Introduction
The spectrum analyzer is the one “go-to” tool for every RF, microwave, and EMC/EMI engineer. In recent years, a new acquisition technology has developed, based on FFT capture and digital signal processing – the real-time (RT) spectrum analyzer. This series of articles will review the basics of conventional swept versus real-time spectrum analyzers and highlight some of the recent advances and instrument form-factors.
Types of Spectrum Analyzers
In this first installment, we will cover the various types of real-time spectrum analyzers.
There are three primary types of spectrum analyzer systems; (1) the classic swept-tuned analyzer, (2) the hybrid FFT analyzer, and (3) the real-time analyzer. There’s a rather blurred distinction between these last two analyzer topologies, as we’ll discuss below.
1. Swept-Tuned Analyzer
This classic topology measures power versus frequency and is based on a superhetrodyne principle. The input spectrum is fed to a low-noise mixer and down-converted via a swept local oscillator (LO) to a baseband intermediate frequency (IF).
The input frequency spectrum is filtered by a band pass filter. This then gets detected and mapped using the appropriate (actual) input spectrum frequency limits (span). The bandwidth of the band-pass filter dictates the resolution bandwidth (RBW) of the measurement.
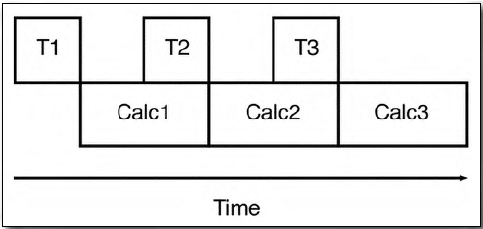
Better frequency resolution equates to longer sweep times, depending on the frequency span selected. Typically, there will be “dead time” (similar to Figure 1) between trace sweeps, where T1, T2, etc., are the sweep times and CALC1, CALC2, etc., are the times taken up by the time between sweeps.

2. Hybrid FFT Analyzer
The hybrid FFT-based analyzer uses much the same input topology as the swept-tuned analyzer, but digitizes the intermediate frequency (IF) from the mixer using a fast Fourier transform of the
input signals. A benefit is the use of digital filtering and associated improved filter shape factors and settling time.
Typically, the analyzer will capture the spectral data, then digitize and perform calculations, then display the results. Because of the processing time, there may be a gap (or dead time) between capturing and displaying the spectral data (Figure 1).
However, with today’s technological advances in A/D converters and FFT processing, there’s little difference any more between the Hybrid FFT analyzer and real-time analyzer. Both are now using the same basic topology with a fixed LO, which is stepped if the span is wider than the FFT window.
3. Real-Time Analyzer
A real-time analyzer uses a stationary LO, looks at narrow windows of bandwidth (real-time bandwidth), and digitizes the incoming spectrum.
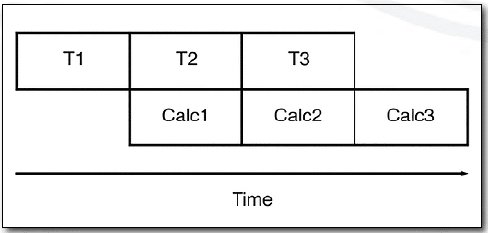
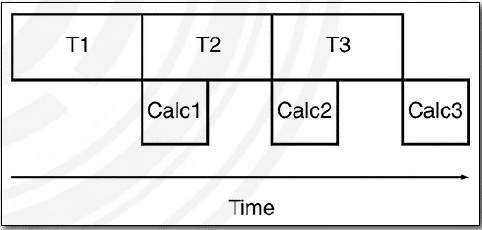
This digitized spectrum is stored in a time record buffer (T1, T2, etc.) and held for processing by the FFT algorithm. Ideally, once digitized, FPGAs process FFTs at a rate equal, or faster, than the collection rate (Figure 2 and 3). However, this collection rate depends on the span and resolution bandwidth.
The major difference between the hybrid FFT analyzer and real-time analyzer is the sheer number-crunching ability of the real-time calculation, as well as a fast graphics processor, which allows for a datadense display of various frequency-versus-time presentations and digital demodulation.

Real-time analyzers often use a stepped LO/FFT approach to cover wide spans. For example, a span setting of several GHz would require the LO be stepped multiple times in order to cover the desired frequency range. In such a mode, the RTSA would have dead time spots similar to the swept analyzer.
If the FFT calculation takes longer than the time required to fill the time record buffer the data collection must stop and there will be a gap (or dead time) between capturing and displaying the spectral data. When the FFT calculation is finished, the time record can be transferred to the FFT and collection of another time record begun.
Because some input data were missed, the analyzer is no longer operating in real time. The time record will vary with the span of the analyzer. For wide frequency spans, the time record is shorter, allowing less time for the FFT calculation.
The frequency span or bandwidth setting where the FFT computation time and time record are equal is the real-time bandwidth (RTBW) of the analyzer. The RTBW for the analyzers in this review range from 27 to 500 MHz.

Faster analog-to-digital converters (ADCs) allow a wider analysis bandwidth. But, as digital signal processing (DSP) has improved the real-time bandwidth has widened out from several MHz to several hundred MHz.
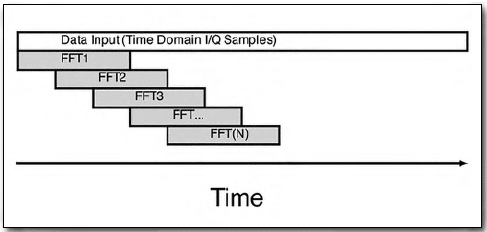
Some advanced analyzers use multiple ADCs and overlapping FFT windows, as well as parallel processing to capture the input spectrum without gaps during the normal dead time (Figure 4). The processing is very fast and can typically catch an intermittent pulse of as little as 1us in duration.

For a more in-depth treatment of spectrum measurements, I recommend Reference 1.
Export Controls
The U.S. government limits the export of some technologies through the Department of Commerce’s Bureau of Industry and Security.
The Export Administration Regulations (EAR), Commerce Control List, Supplement No. 1 to Part 774 specifies that “signal analyzers with both frequency mask trigger and 100% probability of trigger (capture) for signals having a duration of 15μs, or less”, would require export control.
Some analyzers avoid this commerce control by either offering frequency mask triggering or 100% probability of intercept. For more information, visit https://www.bis.doc.gov.

References
[1] Witte, Spectrum and Network Measurements, 2nd Edition, 2014, SciTech Publishing


