Harmonic comb generators are handy tools for validating open area test sites or semi-anechoic chambers and I’ve written extensively on how to use these for various other applications (see References).
Harmonic comb generators produce a range of narrow band harmonics that are typically very stable in amplitude and frequency. One of the major uses is to position one in place of an EUT and ensure the radiated emissions versus frequency in a measurement site or chamber is consistent with past measurements. This is a quick way to validate the measurement system to detect broken cables, bad or loose connectors or other equipment failures in your own measurement system.
Product Description
EMI Devices Corp. (http://www.emidevices.com) has recently developed a high-quality series of harmonic comb generators that range from 8 to 11 GHz in upper frequency. The lower frequency range is 10 or 25 MHz depending on the comb frequency setting. They also sell several wideband antenna kits that work with these generators ($291 to $328). I evaluated the model WJ10-25A ($1,700), which can produce harmonics at either 10 or 25 MHz intervals out to an advertised 8 GHz.
I was also supplied with a model L1600-001 antenna kit that included a model 80-1017-000 cylindrical antenna I’m assuming is a wideband discone style and a model PR-1005-868 “rubber duck” antenna that is normally usable from 750 to 950 MHz. I found this last antenna more efficient at the frequencies below 1 GHz, so would be a good choice for the more common 30 to 1,000 MHz emissions range. The conical antenna works best above 1 GHz. The connectors are all SMA.
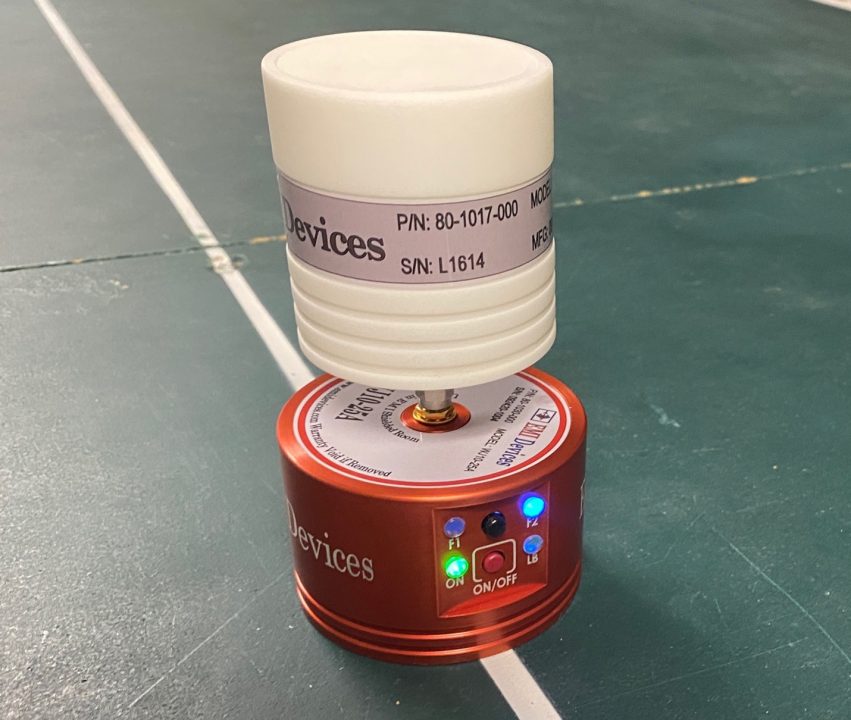
Figure 1 – The comb generator with discone antenna attached.
The generator housing is made of aircraft grade aluminum alloy and is a compact cylindrical design. The internal battery is chargeable and comes with a charging adapter. The operating time is advertised to last over 40 hours and I found it lasted sufficiently for several tests over a period of a couple hours.
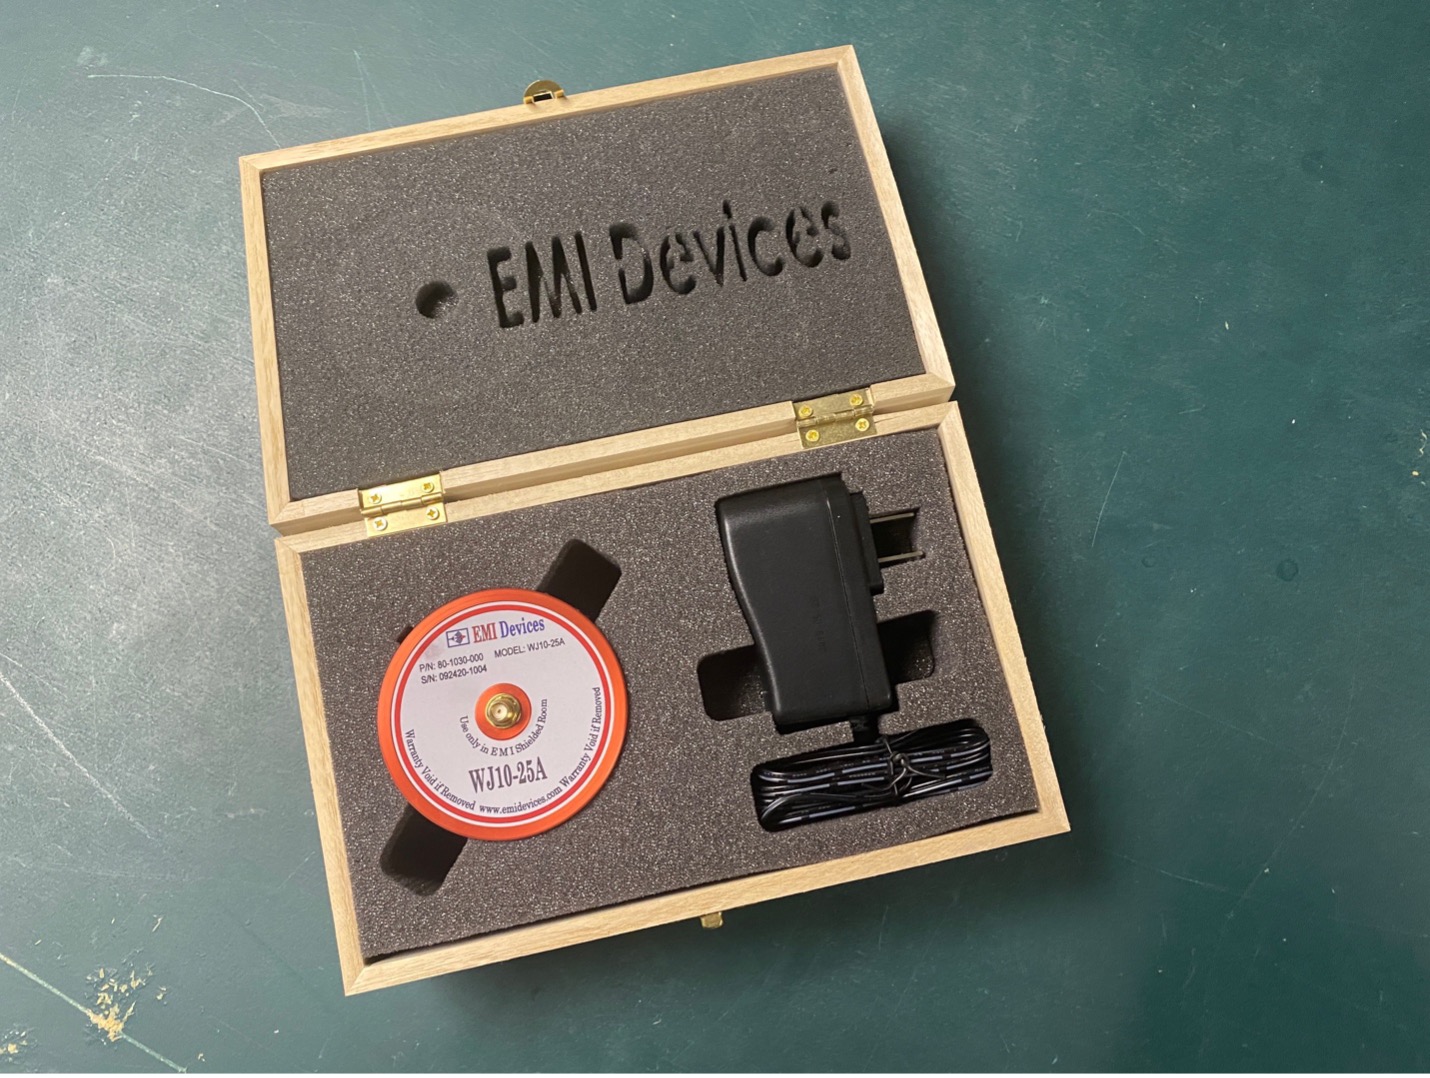
Figure 2 – The harmonic comb generator with charger in wooden storage box.
There are two toggle push buttons; one for power and the other is used to switch between the two harmonic frequencies of 10 and 25 MHz. There is a green LED to indicate power ON and a red LED to indicate “Battery Low”. Two other LEDs indicate “Frequency 1” (10 MHz) or “Frequency 2” (25 MHz) combs. I wish these were labeled with the comb frequency, rather than “F1” and “F2”.
Tests Performed
I tested the comb generator two different ways;
- Radiated at a reduced 1m measurement range and using a Tekbox model TMMA4 double-ridged 1 to 18 GHz horn antenna or Tekbox model TBLM1 30 to 1000 MHz biconical antenna. Both antennas were positioned in the vertical polarization to match that of the comb generator.
- Direct connection to the SMA output port. This method eliminates the antenna resonances and antenna factors and allows observation of the actual harmonic output.
I used a Siglent SSA 3075X-R real-time spectrum analyzer (9 kHz to 7.5 GHz). For this test, I selected a 9 kHz resolution bandwidth in order to resolve the individual harmonics best as they tended to merge together at the upper end of the log-frequency axis.
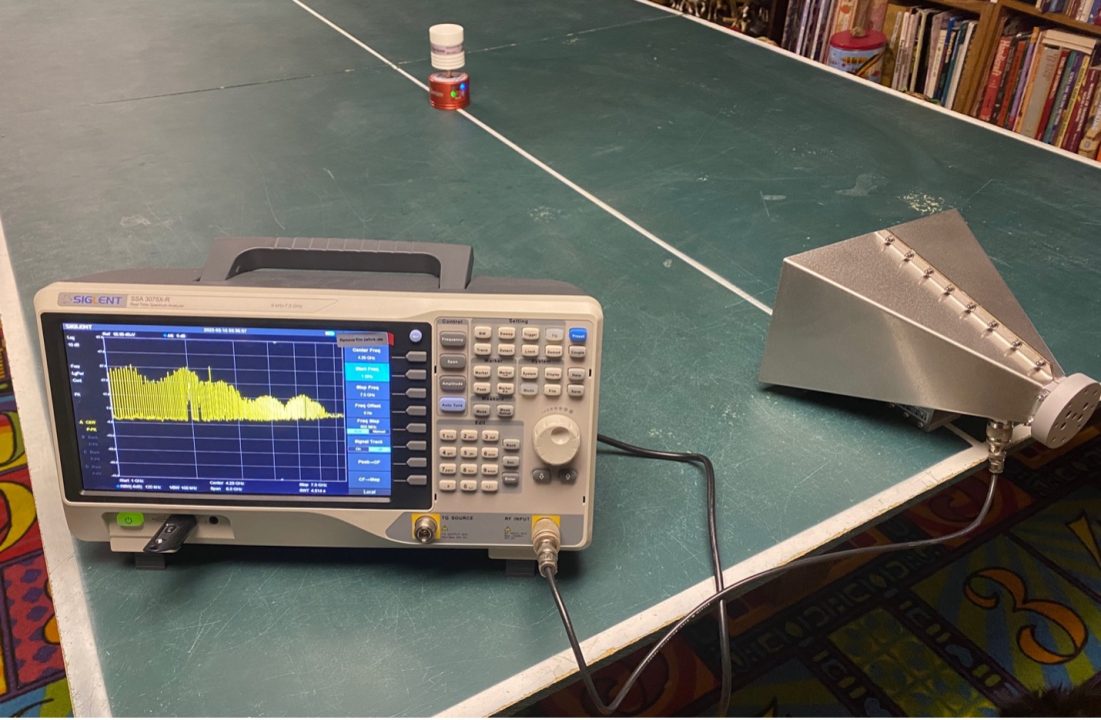
Figure 3 – the general test setup using the discone and double-ridged horn antennas. This was used for frequencies above 1 GHz.
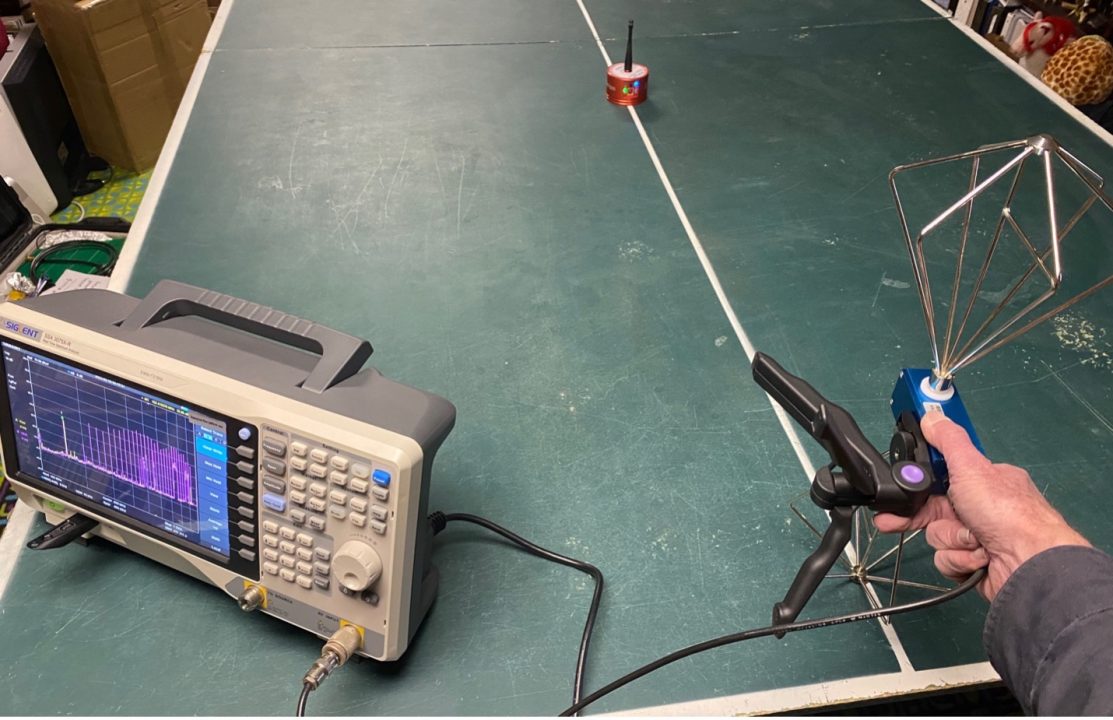
Figure 4 – The general test setup using the “rubber duck” and biconical antennas. This was used for frequencies below 1 GHz.
Radiated Tests
I split the testing into two bands; 1 to 7.5 GHz (limit of my spectrum analyzer) and 10 to 1000 MHz. This allowed the best resolution when measuring either the 10 or 25 MHz combs. The discone antenna was used at the higher frequencies and the “rubber duck” antenna was used for the lower frequencies. Because the test was performed outside a shielded room, ambient signals were noted. In each case, the ambient plot was displayed in yellow and the comb generator in violet.
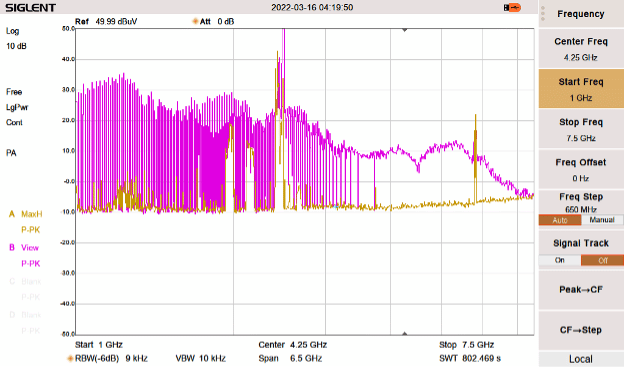
Figure 5 – Frequency: 1 to 7.5 GHz, Comb Frequencies: 10 MHz, Antenna: discone. The yellow trace is the system noise floor with ambient transmitters. Here, you can see the energy falling off rapidly above about 6.5 GHz when driven by 10 MHz combs. An analyzer with better dynamic range may show these missing combs.
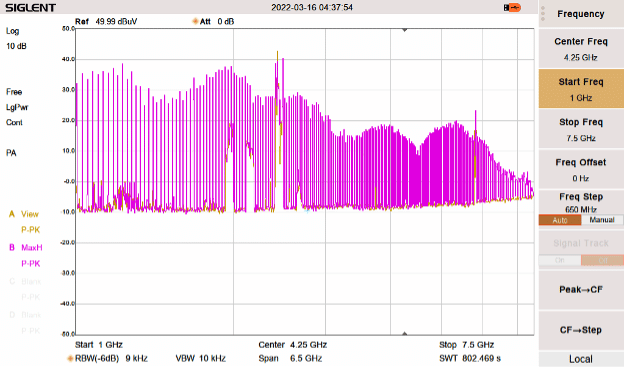
Figure 6 – Frequency: 1 to 7.5 GHz, Comb Frequencies: 25 MHz, Antenna: discone. The yellow trace is the system noise floor with ambient transmitters. Here, you can see the energy continuing out to about 7.5 GHz when driven by 25 MHz combs. Fewer combs equate to more energy and thus, higher amplitudes in the highest frequencies.
Figures 5 and 6 show strong harmonic energy, which starts dropping off above 6.5 GHz. It’s difficult to say whether this drop-off is due to antenna performance, but I suspect the generator is mainly running out of steam at these frequencies.
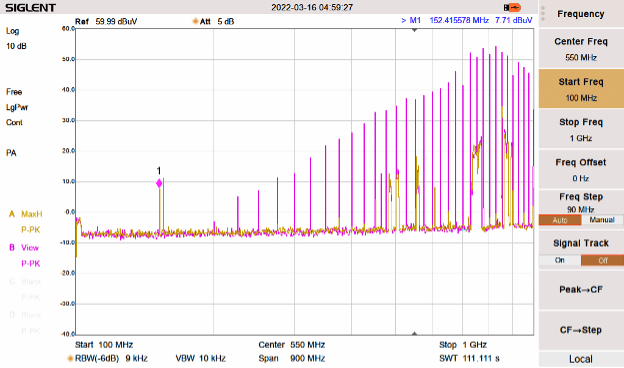
Figure 7 – Frequency: 100 to 1000 MHz, Comb Frequencies: 25 MHz, Antenna: “rubber duck” and Tekbox biconical. The yellow trace is the system noise floor with ambient transmitters. Here, you can see the amplitudes peaking at the antenna resonant frequency when driven by 25 MHz combs.
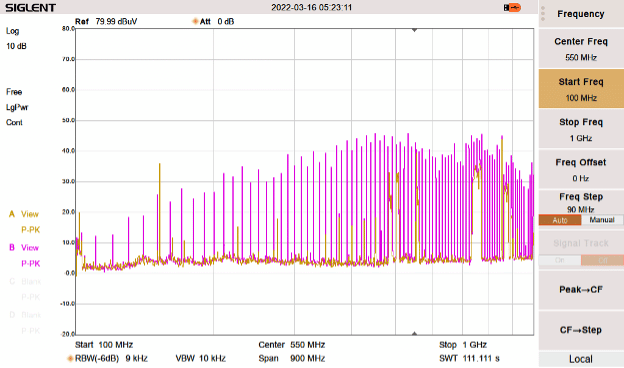
Figure 8 – Frequency: 100 to 1000 MHz, Comb Frequencies: 10 MHz, Antenna: “rubber duck” and Tekbox biconical. The yellow trace is the system noise floor with ambient transmitters. Here, you can see the amplitudes peaking at the antenna resonant frequency when driven by 10 MHz combs. Also note there is more energy and thus usable combs below 200 MHz.
Figures 7 and 8 show reasonable high levels of harmonics above 200 MHz. Below that, the transmitting and receive antennas and are becoming inefficient due to their small physical size. I was unable to see anything significant below 100 MHz, so did not bother to measure there.
Conducted (Direct) Tests
For the tests directly connected to the comb generator output, I used an external 20 dB attenuator to protect the analyzer input, used no internal attenuation, preamp = Off and resolution bandwidth still at 9 KHz. Figure 9 shows the general setup.
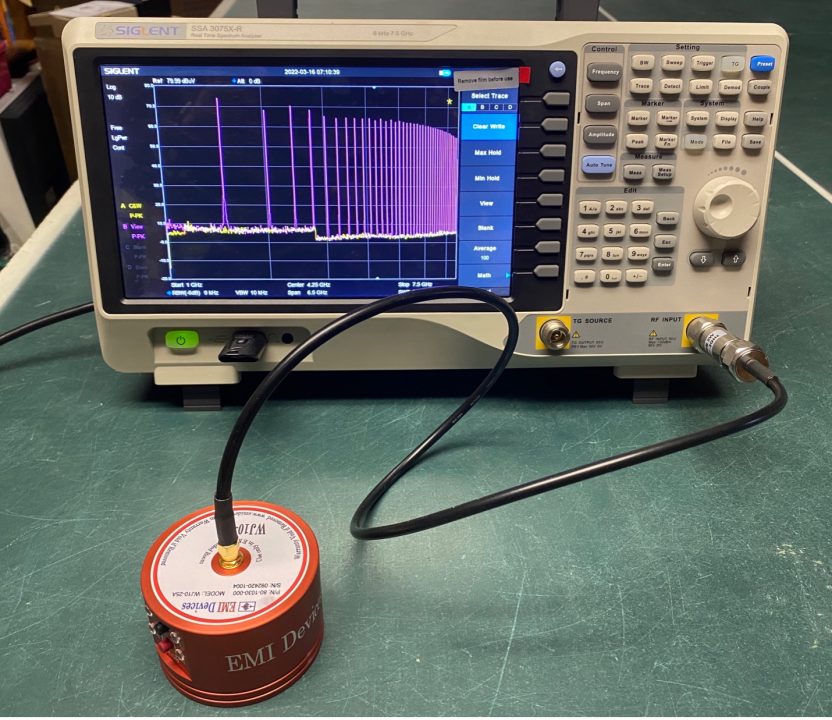
Figure 9 – The general test setup for the conducted (direct) connection to the comb generator.
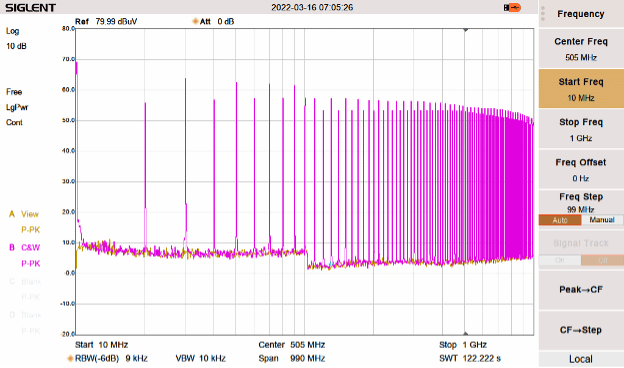
Figure 10 – The direct output from the comb generator, looking from 10 to 1000 MHz with 10 MHz combs. The amplitude is fairly flat, which is important in this most-used measurement range.
Figure 10 indicates strong harmonic energy from 10 to 1000 MHz. This is an excellent flatness, which rivals only the best competitors.
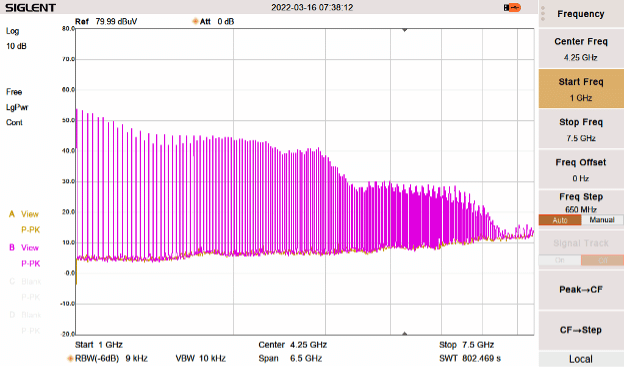
Figure 11 – The direct output from the comb generator, looking from 1 to 7.5 GHz with 25 MHz combs. There is barely usable amplitudes out to 7.5 GHz, with a gap between 6.5 and 7 GHz. An analyzer with better dynamic range may show these missing combs.
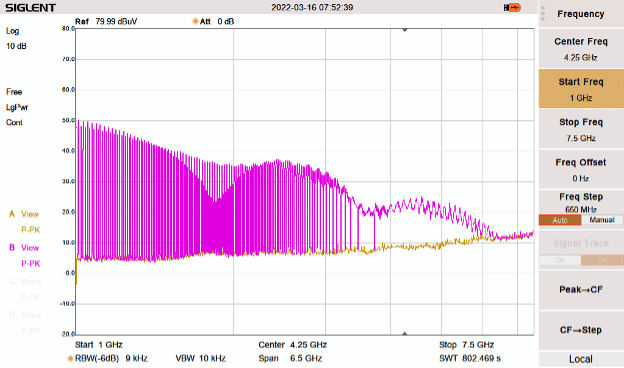
Figure 12 – The direct output from the comb generator, looking from 1 to 7.5 GHz with 10 MHz combs. The output is unusable above 6.4 GHz with this analyzer, which is a good reason to use the 25 MHz comb frequency when needing to measure above 6 GHz. An analyzer with better dynamic range may show these missing combs.
In Figures 11 and 12 we can see the abrupt drop-off above 6.5 GHz. Most commercial measurements for radiated emissions stop at 6 GHz, so this may not be a major factor for most.
Additional Applications
Comb generators may be used for many other applications. I’ve used these to compare one anechoic chamber to another and to help measure cable resonances.
Chamber to Chamber Comparisons – As you may be aware and despite the compliance test lab’s striving for perfection, semi-anechoic chambers may not measure as accurately as you might think. In fact, verification and calibration testing allows for deviations up to ±4 dB from the theoretical site attenuation measurement used for confirming chamber performance.
One local compliance test lab has two 10m measurement chambers with slightly different absorber designs. I was curious how well they compared to each other and used a comb generator from Advanced Electromagnetic Applications model USDS, which uses a spherical dipole antenna, to compare the two chambers.
Figure 13 – shows the comparison. Ideally, the difference should fall along the “zero” vertical line. However, the two chambers differed by as much as 10 to 15 dB in the 100 to 300 MHz band. Between 300 and 800 MHz, the difference was much better at ±5 dB. Measurement differences in the lower frequency ranges where many products tend to fail lead to “range wars” where a client may try two or more test labs in order to get a “pass”.
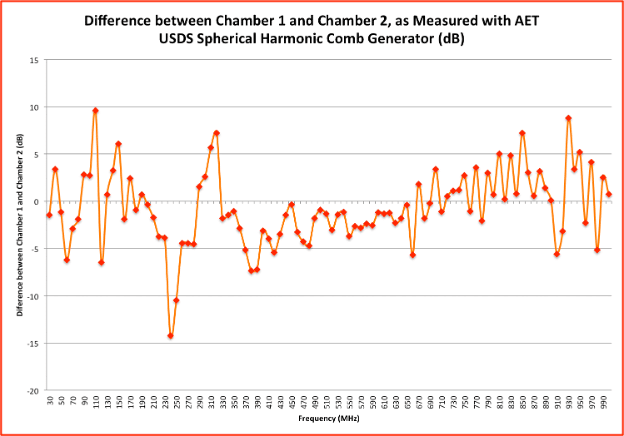
Figure 13 – Use of a comb generator to measure the difference between two 10m test chambers.
Cable Resonance – Cable resonances can tend to accentuate harmonic emissions at the resonant point of interior or exterior cables attached to a product or system. By coupling a comb generator to the cable, the resulting harmonic resonances may be identified.
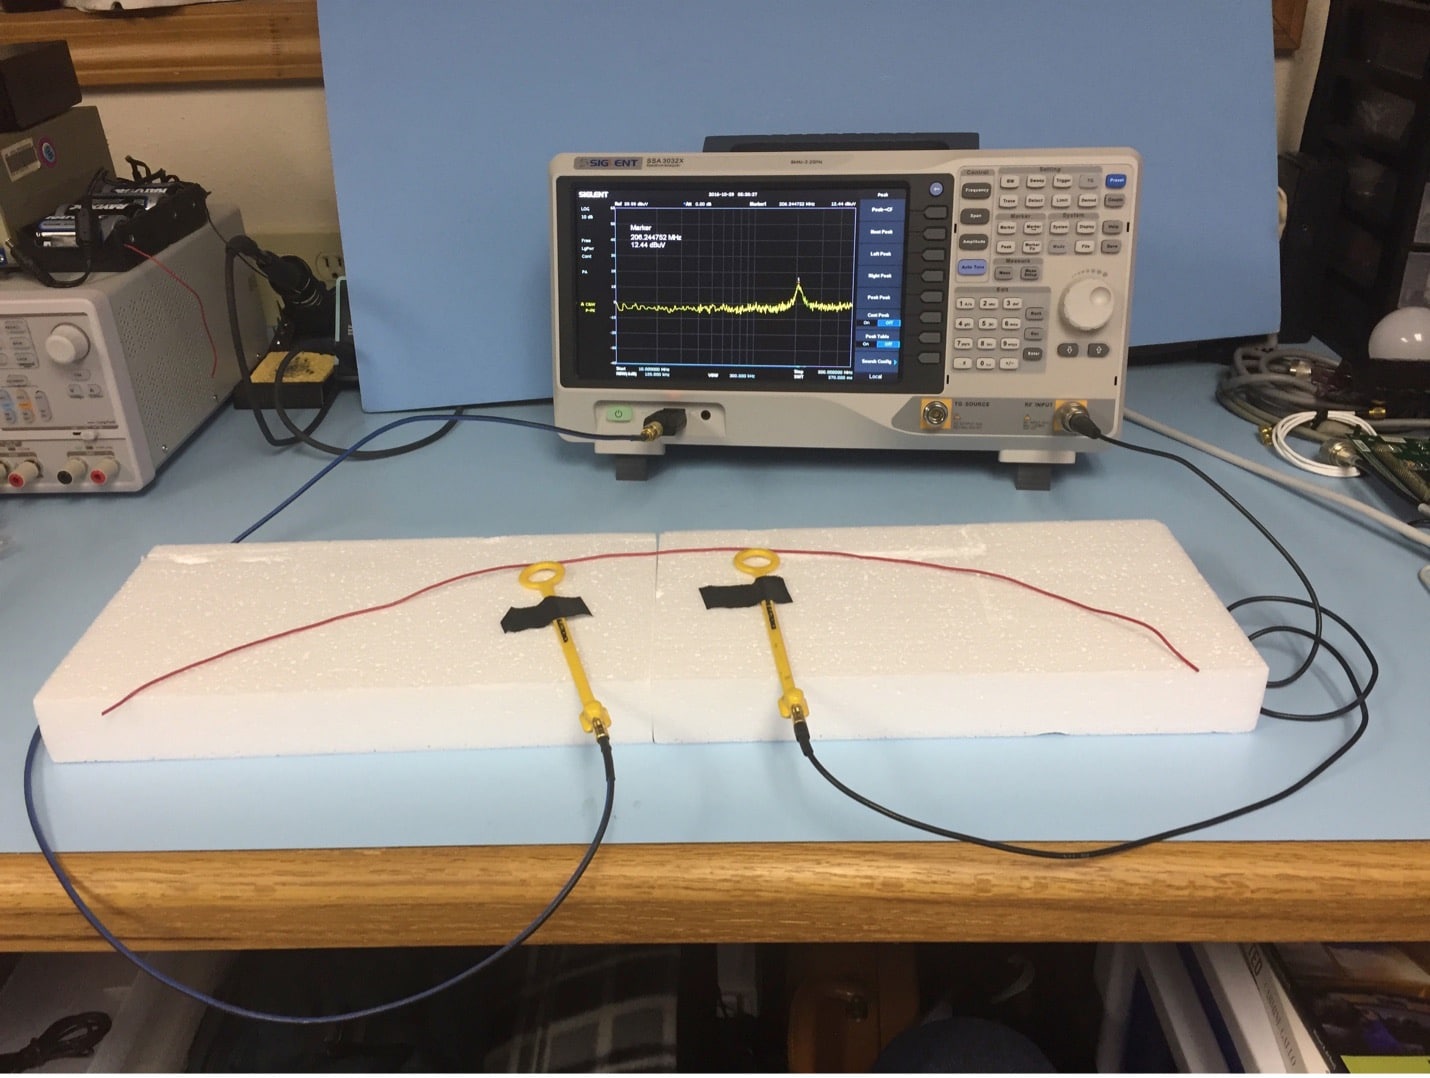
In Figure 14, we couple the direct output of a Picotest J2150A comb generator to the cable using a Beehive Electronics model 100C H-field probe. Adding another H-field probe to a spectrum analyzer allows the harmonic resonances to be displayed. Figure 15 shows the screen capture.
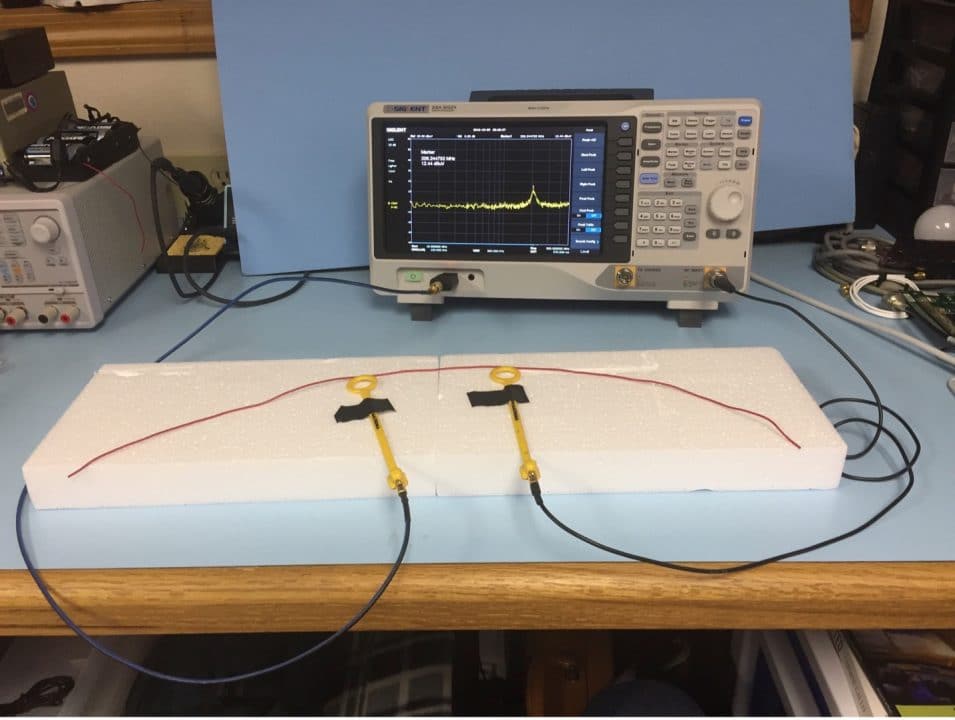
Figure 14 – Test setup using a comb generator connected to a comb generator to excite cable resonances. The resonances may be picked up and displayed on a spectrum analyzer using a second H-field probe.
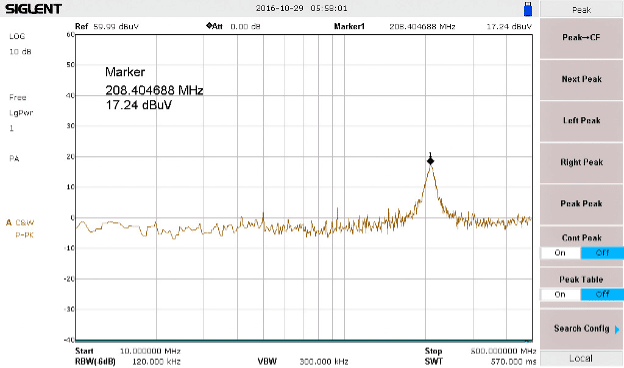
Figure 15 – The resulting resonance of the 62 cm long cable at 208 MHz.
Summary
Applications of comb generators can be extended well beyond simple chamber measurements. It can serve as a test RF source and can be used for resonance measurement, filter tests and shielding effectiveness measurements.
The EMI Devices model WJ10-25A comb generator with model L1600-001 antenna kit appeared to be a high-quality instrument that could generate useful 10 MHz or 25 MHz harmonics up through 6.5 GHz. This may not be an issue form most, because commercial radiated emissions testing usually stops at 6 GHz. The battery life was not measured but lasted through at least a couple hours of testing. This is important when verifying or comparing semi-anechoic chambers.
The “F1” and “F2” labels seemed a bit vague and I had to confirm which was 10 MHz combs and which was 25 MHz combs a couple times during the testing. I suspect as you use this more it will become second nature. When focusing above 1 GHz, I found the 25 MHz comb setting to offer the best amplitudes. Recommended.
References
- Measuring Cable Resonance with a Comb Generator, https://interferencetechnology.com/measuring-cable-resonance-with-a-comb-generator/
- Review: Com-Power’s comb generator for conducted emissions, https://www.edn.com/review-com-powers-comb-generator-for-conducted-emissions/
- Review: Radiating comb generator provides quick harmonic measurements, https://www.edn.com/review-radiating-comb-generator-provides-quick-harmonic-measurements/
- Review: Picotest J2150A harmonic comb generator, https://www.edn.com/review-picotest-j2150a-harmonic-comb-generator/
- Review: The AET USDS spherical harmonic comb generator, https://www.edn.com/review-the-aet-usds-spherical-harmonic-comb-generator/
- Measuring resonance in cables, https://www.edn.com/measuring-resonance-in-cables/
- DIY 6 GHz comb generator, https://www.edn.com/diy-6-ghz-comb-generator/
