The reverberation chamber provides the most realistic simulation/equivalency for electronics functioning within a cavity.
Er-Ping Li and Xing-Chang Wei
Electromagnetic Labs, Institute of High Performance Computing, Singapore
INTRODUCTION
The problem is familiar, but growing. The widespread and ever-growing use of electronic devices with high-speed components increases the perils of electromagnetic interference. In this modern age, there is concern about the biological impact on human beings and the deleterious effects EMI poses for electronic equipment. As a result, international and governmental bodies have established standards regarding electromagnetic emissions, immunity, and testing procedures.
Testing for devices/systems’ compliance with these international standards has led to the development of various test facilities, specifically designed to carry out the various tests for EMC (electromagnetic compatibility). For example, RFI/EMI immunity testing is done using a TEM cell, anechoic chamber or shielded room. Recently, a new testing technique for RFI/EMI immunity has drawn increasing attention: testing using a reverberation chamber. A reverberation chamber is a large cavity formed by highly conductive walls equipped with metal stirrers. These stirrers change the electromagnetic field distribution within the cavity and thus provide a statistically isotropic and uniform field environment for the duration of EMI measurement and testing. 1, 2, 3
Over the years, the reverberation chamber has been employed for more and more electromagnetic testing, such as antenna measurement4 and the channel modelling of mobile communication.5 The major advantages of the reverberation chamber over the traditional anechoic chamber are:
- High conductivity allows for high field levels using moderate input power;
- Low construction costs are possible since no absorbers are needed;
- The most significant advantage is that the reverberation table provides the most realistic simulation/equivalency for electronics functioning within a cavity—such as an aircraft, a room, or a cabinet.
The reverberation chamber for EMC measurement was firstly proposed in 1968.6 Unfortunately, not everyone was ready to embrace the concept of a statistically uniform environment for EMC testing, a marked departure from the traditional uniform environment achieved by absorbing the unwanted reflections from the environment or by placing the EUT (equipment under test) in a free space. Still, after extensive research, reverberation testing was finally recognized by the EMC community. In fact, use of a reverberation chamber has become far more common, especially in the aerospace, automotive, and defense industries in the U.S. and Europe.
In Singapore, the EMC research community has been in the vanguard of reverberation chamber research and applications. The reverberation chamber testing technique was introduced to the region in 1999. The EMC research group at IHPC designed and built a small size reverberation chamber in Singapore in 2000 for research testing, and also conducted a comprehensive research of reverberation characteristics using electromagnetic CAD techniques. Over the years, the EMC community in Singapore has been actively involved in reverberation chamber development and applications and built a number of RC sites for the EMC testing of domestic electrical and electronic products, including automotive and aerospace applications. This work triggered increased reverberation chamber activity throughout Asia, where this test method was researched and used more extensively. In particular, significant progress has taken place since 2003, when the IEC published its Standard 61000-4-21 that calls for the use of the reverberation chamber for EMC testing.
Reverberation Chamber Characteristics
A reverberation chamber is usually a rectangular enclosure with perfectly conducting walls, where the equipment under testing is placed inside a rectangular working area during the EMC/EMI testing. Inside a closed cavity with perfectly conducting walls, the electromagnetic field distribution is characterized by a standing-wave pattern because of the reflection from the walls. According to electromagnetic theory, there are many different modes within electromagnetic fields. Each mode represents a certain space pattern of the standing-wave distribution of electromagnetic fields. The field value is the summation of all existing modes inside the chamber. The mode will change with the boundary of the cavity, thus changing the standing-wave pattern within the cavity boundary. Usually, stirrers are used to change the boundary of the chamber inside a reverberation chamber,. During the rotation of the stirrers, every position inside the working volume experiences the wave fluctuation, and it is expected that they will be subjected to the same maximum, minimum, and average electromagnetic field values. In this case, this chamber is called well-stirred, and it can provide a statistically uniform environment for EMC/EMI testing.
When a linear receiving antenna is placed inside the working volume of a well-stirred chamber, its averaged received power throughout the rotation of the stirrers should be unaffected as regards its polarization, direction, and position. These are the isotropic, non-directional, and uniform properties of the ideal chamber. With these properties, the EUT placed inside the working volume will be tested accurately—i.e. without any test results being skewed by the test set-up itself. For an actual chamber, statistical requirements must be satisfied within some limits of uncertainty. There are criteria for the quantitative evaluation of the statistical parameters of a working chamber. One often-used criterion is the Chi-square hypothesis: the power received by a linear antenna during the stirrers’ rotation should follow the Chi-square distribution within two degrees of latitude. Another criterion is the field uniformity: the maximum values of x, y, and z components and the root mean square (RMS) of the electric field over stirrer’s rotation should be uniformly distributed within the working volume. Many standards8,9 site a degree of tolerance, which the standard deviation of these maximum values cannot exceed. In the third part of this paper, the compliant environment of an existing chamber is verified using these criteria.
To provide a qualified statistically uniform environment, the chamber should work in over-mode condition, and the stirrers must be efficient. In some standards, over-mode condition is stipulated as a mode number no less than 100. The mode number increases with the size of the chamber and the operating frequency. Consequently, the chamber dimension is determined by the lowest usable frequency set forth in the over-mode condition. The stirrer must alter the boundary sufficiently to effect a statistically significant change in the field pattern of the chamber. Once such a change has occurred in the field structure, any samples obtained from the fields resulting from the new stirrer position are said to be statistically independent of those obtained using the previous stirrer position. The efficiency of stirrers is validated by the number of statistically-independent samples they can provide. In the third part of this paper, the number of independent samples is calculated according to the correlation coefficient.
Reverberation Chamber Facility and Its Measurement System
The following section describes the testing results of a new reverberation chamber built in Singapore. The test chamber was built for both industrial and military electronic and electrical equipment testing. The chamber’s electromagnetic performance has been optimized by using an electromagnetic simulator, the “ Ansoft HFSS.”


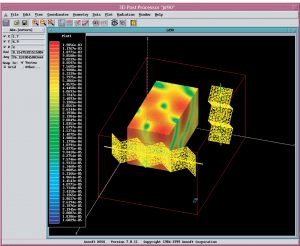
A typical field distribution is shown in Figure 1(a), and the construction model is shown in Figure 1(b). The reverberation chamber system consists of one large shielded enclosure, one control room, and one amplifier room. The instrument and the control PC are located in the amplifier room and control room. For efficient stirring of the field patterns, two stirrers (horizontal and vertical) are positioned within the chamber. The horizontal stirrer acts as the primary stirrer, and is larger than the vertical one.
The overall reverberation chamber control schematic is shown in Figure 2. In this system, all instruments are controlled by a desktop computer through the GPIB bus system. The gray lines in Figure 2 represent the GPIB bus. The stirrers are driven by the motors, which are controlled by the computer through the motor controller. The systems are centrally controlled and monitored by the control software named “RC soft” from Ansoft Corporation. This software automatically tunes the stirrers, controls the instruments to collect the measurement data, and analyzes the measured results.
For accurate calculation of the power transmission efficiency, all the losses of all cables connecting the instruments must be determined before the testing is carried out. Still, it is not feasible to measure each cable’s power loss. To reduce testing and calibration time, the control system shown in Figure 2 is calibrated as a whole instead of calibrating each cable and instrument individually. There are three parameters that must be calculated during this calibration: the forward gain , reverse loss , and the cable losses of the receiving antenna LRx, (See Figure 2.)

Calibration Results
The calibration and commissioning of the chamber were performed according to the standard IEC 61000-4-218,including the crucial parameters—efficiency of stirrers, Chi-square hypothesis, and field uniformity. The measured results are shown as follows:
The efficiency of stirrers is estimated by the correlation coefficient8of the power received throughout the duration of the stirrers’ rotation. A smaller correlation coefficient indicates improved efficiency. However, the measured correlation coefficient rO will change with the sample number. For example, the measured rO is expected to be larger for a smaller sample number N. To calculate the influence of the sample number on the measured correlation and to ensure an accurate evaluation, the significance level α is used. The significance level is a quantitative evaluation of the impact of a measured correlation coefficient. The significance level is defined as 10

where Γ is the gamma function. Thus, if we obtain a correlation coefficient in which a is smaller, it is unlikely that the samples are uncorrelated. In fact, the sample number calculated above is larger than the maximum independent number that the chamber can provide. Based on a given α, we can calculate the maximum independent number that the stirrers can provide. Usually, with α, the correlation is called significant; and with α, the correlation is called highly significant.

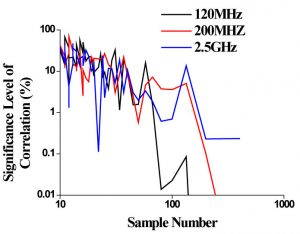
The significance level in relation to different sample numbers for three different frequencies is shown in Figure 3, where the transmit antenna is placed in a corner, and the receiving antenna is placed at the center of the working volume. The maximum sample number is 400, where the step number for horizontal and vertical stirrers are 40 and 10, respectively. We have observed that the significance level is improved for the smaller sample number. On the other hand, given the electromagnetic property of the chamber, we can expect that as the sample number is reduced, the stirrer will change the boundary more efficiently because of a larger tuning step. Therefore, the data are expected to be more uncorrelated when dealing with a smaller sample number. The calculated significance level agrees well with this conclusion.


The Chi-square validation ensures that the chamber has met the statistical requirement. In the stirrer efficiency validation used here, the level of the Chi-square is defined based on the error between measured data and the theoretical data.11 Figure 4 shows the significance level for 200 MHz and 2.5 GHz. Figure 5 indicates the measured probability distribution function based on 400 samples at 200 MHz and 2.5 GHz. The agreement of the chi-square distribution is good.
The chamber field uniformity is validated from 80 MHz to 18 GHz. A reverberation chamber can be used to perform tests at and above the frequency at which the chamber meets the field uniformity requirements. Figure 6 shows the measured standard deviation of three electric field components: Ex, Ey, and Ez, and the RMS value of the electric field. The uniformity tolerance of the IEC 61000-4-21 standard is plotted for comparison. The testing procedure also follows that standard8, where eight corners of the working volume are tested, and for each corner 75 (80 MHz – 200 MHz) and 12 (200 MHz – 18 GHz) stirrer positions are used. Observe that the field uniformity satisfies the requirement.
SUMMARY
A large reverberation chamber was built for the EMC testing of electrical and electronic equipment, including automotive and military devices. Calibration and commissioning was carried out, and the reverberation chambers complied with the requirement of an international standard.
REFERENCES
[1] Lehman, T.H. “A statistical theory of electromagnetic fields on complex cavities,” Interaction Note Series, Note 494, May 1993.
[2] Hill, D.A., “Plane wave integral representation for fields in reverberation chamber,” IEEE Transactions on Electromagn. Compatibility. Vol. 40, pp. 209 –217, August 1998.
[3] Freyer, G.J., T.H.Lehman, J.M.Ladbury, G.H.Koepke, and M.O. Hatfield, “Verification of fields applied to an EUT in a reverberation chamber using statistical theory,” IEEE International Symposium on Electromagnic. Compatibility . Vol. 1, pp. 34 –38, August 1998.
[4] Kildal, P.S., C. Carlsson, and J.Yang, “Measurement of free-space impedances of small antennas in reverberation chambers,” Microwave and Optical Technology Letters, Vol.32, pp. 112 – 115, January 2002.
[5] Hallbjorner, P. “Reverberation chamber with variable received signal amplitude distribution,” Microwave and Optical Technology Letters, Vol.35, pp. 376 – 377, December 2002.
[6] Mendes, H. A. “A New Approach to Electromagnetic Field Strength Measurements in Shielded Enclosures.” Wescon Technical Papers, Wescon Electronic Show and Convention, Los Angeles, CA; 1968.
[7] J.,Ladbury, G.Koepke, and D.Camell, “Evaluation of the NASA Langley Research Center mode-stirred chamber facility,” NIST Technical Note 1508, January 1999
[8] IEC 61000-4-21, Electromagnetic compatibility (EMC) – Par t4-21: Testing and measurement techniques – Reverberation chamber test methods, August 2003.
[9] RTCA/DO-160E, Environmental conditions and test procedures for airborne equipment, section 20-radio frequency susceptibility, December 2004.
[10] O.Lunden and M.Backstrom, “Stirrer efficiency in FOA reverberation chambers. Evaluation of correlation coefficients and chi-squared tests,” Proceedings of the IEEE International Symposium on Electromagnetic Compatibility, Vol. 1, pp. 11 – 16, August 2000.
[11] X.C.Wei and E.P.Li, “Transmitting Antenna’s Reflected Power and Its Influence on Reverberation Chamber Calibration,” IEEE Transactions on Electromagnetic Compatibility, Vol. 49, pp. 192 – 194, February 2007

