This is Part 2 in a series of articles which review the basics of conventional swept versus real-time spectrum analyzers and highlight some of the recent advances and instrument form-factors.
Read Part 1, Guide to Real-Time Spectrum Analyzers: Types, here.
Introduction
There are several terms that are important when evaluating real-time spectrum analyzers. Some of these terms include; (1) Probability of Intercept (POI) and the related Minimum Detection Time, (2) Density and Persistence, (3) Spectrogram, and (4) Decimation.
These terms are defined below.
1) PROBABILITY OF INTERCEPT (POI) OR MINIMUM DETECTION TIME
Users want to know, “What is the shortest duration of an event (or pulse) that I can dependably observe?”
This is a quantity best expressed as a unit of time. In simple terms, the actual attainable minimum detectable value depends on factors such as sample rate (frequency span), window function, trigger level, noise level and the maximum amplitude of the signal of interest.
The difference between analyzer noise level and input signal amplitude is the key determining factor: the greater the offset, the shorter the minimum detectable duration; the lower the offset (especially less than 20 dB), the greater the likelihood of noise interfering with the measurement. For a more in-depth treatment of this, refer to Reference [1].
This is the minimum pulsed signal the real-time analyzer can detect. For example, Reference [2] describes a sample calculation:
Example: for an analyser with 40 MHz of realtime bandwidth (the maximum RF span that can be processed in realtime) approximately 50 Msample/second (complex) are needed.
If the spectrum analyzer produces 250,000 FFT/s an FFT calculation is produced every 4 μs. For a 1024 point FFT a full spectrum is produced 1024 x (1/50 x 106), approximately every 20 μs. This also gives us our overlap rate of 80% (20 μs − 4 μs) / 20 μs = 80%.
2. DENSITY AND PERSISTENCE
The advantage of real time analyzers is that they can show a lot of data on the display, including very fast moving or intermittent signals. By increasing the density (or intensity) of the plot, the difference between infrequent and steady signals may be visualized easily.
By varying the persistence, brief signals will show up longer on the display and then gradually disappear. The better analyzers allow a variable persistence. In addition, different signal levels can be mapped to different colors forming a multi-color display of spectral activity.
3. SPECTROGRAM
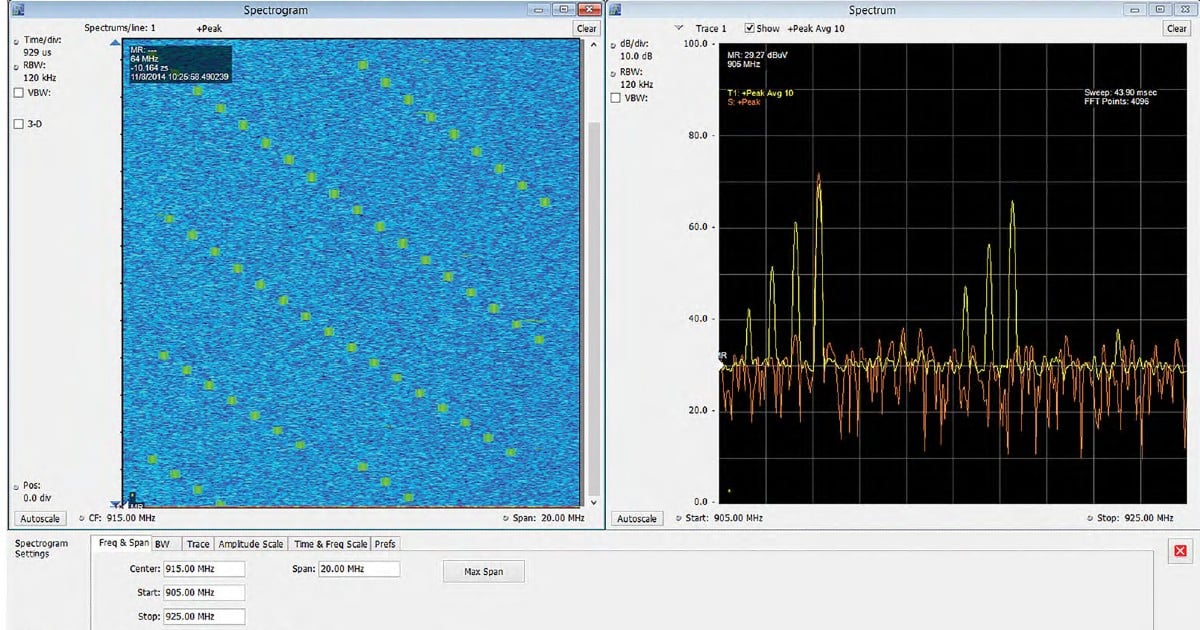
A spectrogram (or waterfall) display shows how the RF spectrum varies with time (Figure 1).
The spectrogram display shows all three dimensions of frequency, signal level, and time. The color of the spectrogram indicates the signal level with red normally indicating a higher level and blue indicating a lower level.

Using the spectrogram, it’s easy to visualize intermittent and dynamic behavior of signals. The better analyzers allow a user-adjustable time line, from fast to slow. This record may also be recorded on some analyzers for future playback.
4. DECIMATION
The Nyquist theorem states that for baseband signals you only need to sample at a rate equal to twice the highest frequency of interest. For band pass signals you just need to sample at a rate at least twice the bandwidth.
The sample rate can be reduced when the needed bandwidth is less than the maximum. Sample rate reduction, or decimation, can be used to balance bandwidth, processing time, record length and memory usage.
REFERENCES
[1] Understanding and Applying Probability of Intercept in Real-Time Spectrum Analysis.
https://www.keysight.com/us/en/assets/7018-04381/application-notes/5991-4317.pdf
[2] “Spectrum analyzer.” https://en.wikipedia.org/wiki/Spectrum_analyzer
[3] Implementation of Real-Time Spectrum Analysis.


