In EMI/EMC troubleshooting, near field probes (NFPs) are great tools. Let’s review how to understand what you really see at the screen of your instrument with a magnetic near field probe.
EMI/EMC problems (radiated and conducted emissions) are usually related with current in your circuits: high frequency currents (i.e. high di/dt currents) are responsible of radiation from PCBs, cables, slots and apertures, ground noise, crosstalk, etc.
That is because a magnetic field probe (loop) is a great help to identify where the culprit signal is being created (ringing, parasitic oscillations, harmonics, etc.).
And it is common to use near field probes with spectrum analyzers. In this way, you see the spectrum of the signals close to the probe and it is easy to measure the frequencies involved in the test. Sometimes no more info is needed.
But, have you ever thought about what you have in the screen of your instrument? Is magnetic field? Is current in your circuit? Is voltage in your circuit? … Think.
Near field probes give us a voltage applied to the input impedance of the instrument (50 ohm or 1 Mohm, typ.) so, what is exactly that voltage?
I will try to explain the idea with a very basic experiment as in Fig.1.

Fig. 1. Fig. 1. The setup of our experiment.
The signal from a signal generator with 50 ohm output impedance is applied to a 50 ohm trace in a two layer PCB. The line is terminated with 50 Ohms.
A square wave signal with 20 MHz frequency is applied to the circuit with our signal generator and our magnetic near field (ROUND) probe is located close to the signal and connected to channel 2 of the oscilloscope (Agilent InfiniVision DSO 7104B) using a low noise and linear amplifier.
The FFT of the signal (or you can use your spectrum analyzer) is observed in the screen in channel 2, CH2 (Fig. 2):
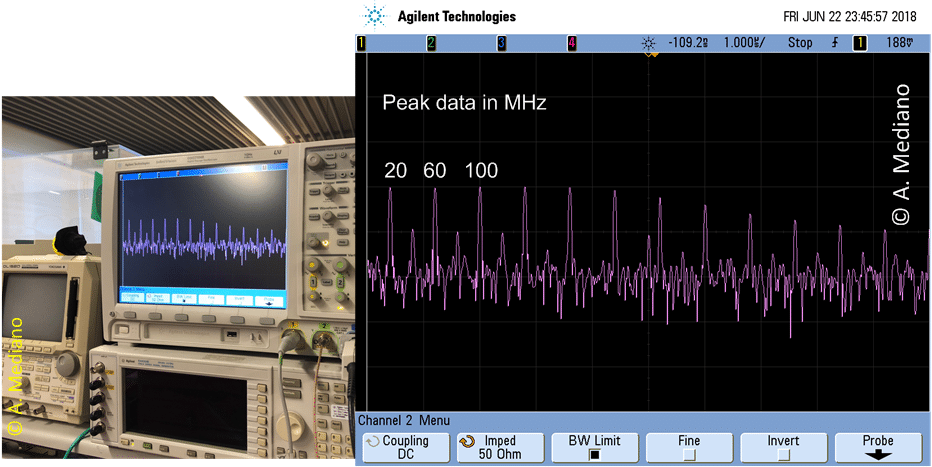
Fig. 2. The frequency domain for the output of our near field probe.
What we see on the screen is the FFT of a VOLTAGE (the output voltage of the near field probe on the input impedance of the scope). How is that voltage related with currents and voltages in the circuit?
Remember with the probe we capture magnetic field lines (the probe is shielded for electric fields) and we can identify the harmonics of our 20 MHz “clock”. Note odd harmonics are bigger than even harmonics.
Let us add two additional probes to our experiment: the voltage in the load resistor will be measured in channel 1 (CH1) with a passive (x10) probe and the current in the circuit will be measured in channel 3 (CH3) as explained in Fig. 1 and in Fig. 3:
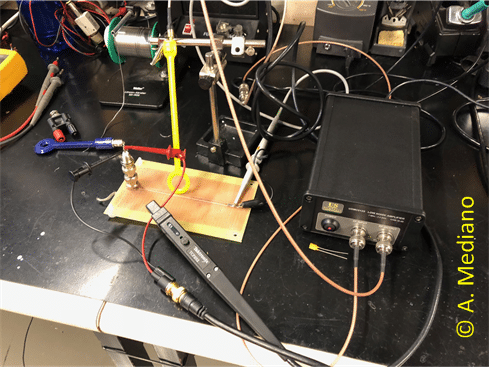
Fig. 3. Detail of the experiment.
In Fig. 3 you can see the PCB board, the near field probe (from Beehive), the Tektronix TCP202 current probe, and my US Microwave Laboratories USMC0125 Low Noise Amplifier (a really useful tool for any EMI/RF lab).
We configure the output of the signal generator to SINUSOIDAL waveform (20 MHz frequency). In Fig. 4 we see the screen of our instrument.
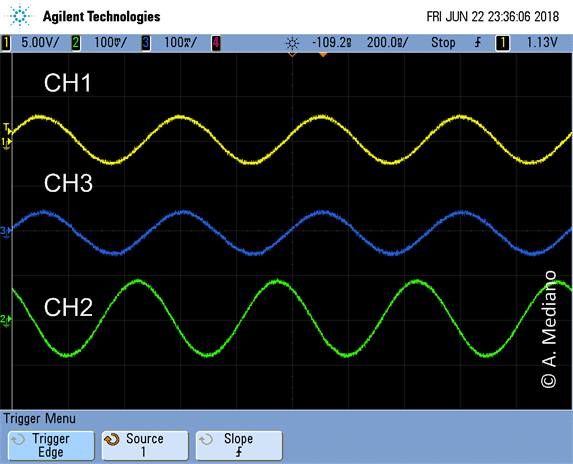
Fig. 4. Measurements for the second experiment: voltage in load resistor (CH1), current in the circuit (CH3), and near field probe output (CH2).
Note CH1 and CH3 are in phase (resistive load for the signal generator)
If you see CH2 in spectrum analyzer, FFT or time domain (without seeing CH1/CH3) perhaps you will not appreciate that CH2 and CH3 are related but they are not the same signal. The near field probe is measuring magnetic field so the output voltage is proportional to magnetic field. You can see that CH3 and CH2 are 90º approx. in phase difference.
Sometimes in the spectrum point of view this is not a problem if you are interested in measuring the frequency (i.e. measuring some ringing) but in other situations while troubleshooting serious problems is important to consider the difference.
Now, change the output of the signal generator to SQUARE waveform again (20 MHz frequency). In Fig. 5 we see the screen of our instrument.
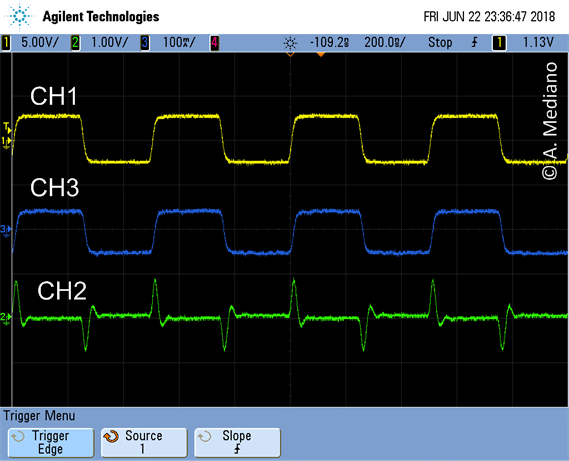
Fig. 5. Signals with square waveform in signal generator.
Now, the waveform is changed to square and you can appreciate CH3 and CH2 are fully different.
The reason for this behavior is the near field probe close to your circuit trace (or wire) is picking-up magnetic field lines and we can represent the coupling effect like a transformer with a primary (your circuit with current i) and a secondary (the near field probe). The output of the secondary is exactly M·di/dt (where M is mutual inductance or coupling factor between the circuits) so, it is proportional to the derivative of current in your circuit!
Again with Fig. 5 we see clearly that the output of the near field probe (CH2) is proportional to di/dt (blue trace in CH3).
If you rotate the near field probe 180º the screen changes as in Fig. 6.
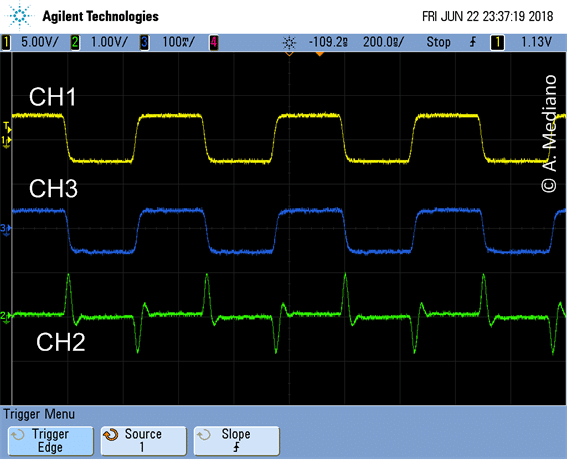
Fig. 6. Signals with square waveform in signal generator rotating the near field probe 180º.
Another interesting plot is the FFT for the current probe and for the NFP output for comparison (Fig.7).
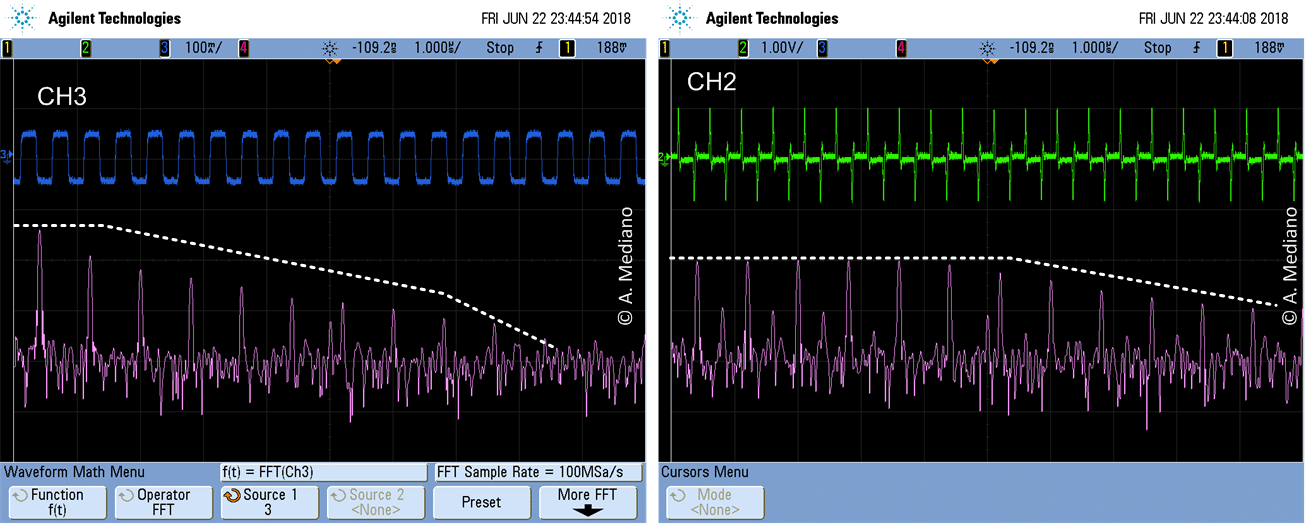
Fig. 7. The spectrum of current (CH3) and near field probes (CH2).
The spectrum of CH3 is the spectrum of a square wave signal, reducing harmonic amplitudes at -20 dB/decade and -40 dB/decade.
For the NFP (CH2) the low frequency components are with constant amplitude up to medium frequencies because the very small duty cycle of the waveform (remember the comb generator signals or the spectrum of impulsive signals).
So, remember: when using a ROUND magnetic near field probe, you will see in the screen of your instrument the time or frequency domain of the derivative of the current in your circuit.
Tip: with lower frequencies perhaps you can integrate with your scope to see the current in your screen.
In a future article I will try to explain what happens with a SQUARE near field probe.
