Christian Hoffmann, Technische Universität München, Lehrstuhl für Hochfrequenztechnik, Munich, Germany; Stephan Braun, GAUSS Instruments GmbH, Munich, Germany
Arnd Frech, GAUSS Instruments GmbH, Munich, Germany; Peter Russer, Technische Universität München, Lehrstuhl für Nanoelektronik, Munich, Germany
Time-domain electromagnetic interference (EMI) measurement systems are widely used, especially for the measurement of non-stationary signals. The newest CISPR 16-1-1 Ed. 3 Am. 1 [1] adds specifications like gapless acquisition for such instruments. Such instruments are called FFT-based measuring instruments. Several publications focused on the frequency range up to 1 GHz exist on this topic e.g. [2]. Broadband emissions below 1 GHz are typically generated by switching processes caused by devices like household appliances or industrial equipment.
Above 1 GHz, there are devices that exhibit broadband non-stationary emissions. In order to protect modern communication systems above 1 GHz like Wi-Fi, such devices have to be measured, weighted and compared to limit lines. A particular point of interest in this respect is industrial, scientific and medical (ISM) equipment according to CISPR 11 [3]. Currently such measurements are carried out by using a spectrum analyzer in repetitive sweeps and applying the max hold function. If the peak level is above the limit line, the measurement is repeated with a video bandwidth of 10 Hz, which corresponds to a logarithmic average detector. Other discussions focus on the use of the amplitude probability density (APD) function for measurements of ISM equipment above 1 GHz. However, as the traditional EMI receivers can only observe the signal at one frequency at the same time, and the emission is changing over periods of several seconds, those receivers are not well suited to measure non-stationary EMI with reasonable scan times. Time-domain EMI measurements systems, using an FFT-based bank of receivers allow to make such measurements faster, and allow also to optimize the components of ISM equipment to obtain compliance according to CISPR 11.
In [4], a time-domain EMI measurement system up to 18 GHz is presented. In this paper, an overview of the theory of operation and the practical application of such a measurement system is shown. The system presented in this paper allows for EMI measurements, fully compliant to CISPR 16-1-1. Measurements have been carried out in the frequency range up to 18 GHz in a full anechoic room. These measurements show as an example the emission of a microwave oven in the ISM band at 2.45 GHz with real-time spectrograms of the fundamental and a subharmonic of the microwave oven’s magnetron.
HETERODYNE MEASUREMENT RECEIVERS
Since the beginning of the 20th century, measurement receivers based on the heterodyne principle have been predominantly used to characterize EMI. As an example, companies like General Electric and Siemens have started the development of such systems in the 1920s [5][6].
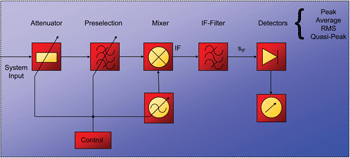
The block diagram of a heterodyne measurement receiver is shown in Figure 1. The EMI input signal is bandpass filtered by a variable preselection filter. Thus, the dynamic range is increased by attenuating out-of-band narrowband and transient broadband interference signals. The preselection typically consists of several selectable bandpass filters that are tunable within a certain frequency range. By means of a variable attenuator, the level of the input signal to the mixer is set in order not to overdrive the mixer and minimize distortion of the IF-signal. Every considered frequency is then consecutively down-converted to a fixed IF frequency. The IF-signal is filtered by the chosen IF-filter. Thereby it is assured, that only a specific band of the IF signal is reaching the detector input. CISPR 16-1-1 dictates the use of several IF-filters of different bandwidths that have to fulfill the given critical masks. The output signal is evaluated by a given set of detectors for the selected dwell-time. The average, CISPR-Average, peak, quasi-peak and rms detectors are used to measure EMI signals according to CISPR 16-1-1. The amplitude spectrum is displayed.
Figure 1. Heterodyne EMI receiver.
Heterodyne EMI receivers offer high dynamic range through a complex preselection, high sensitivity through low-noise preamplifiers and are commonly available up to millimeter wave frequencies. The major drawback of this technology are the long scan times. The scan time can easily reach hours or days, when wide measurement bands shall be measured with high frequency resolution and high sensitivity.
TIME-DOMAIN MEASUREMENT SYSTEM
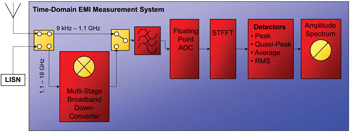
The block diagram of the time-domain EMI measurement system is shown in Figure 2. The EMI input signal in the frequency range from 9 kHz-1.1 GHz is low-pass filtered to ensure Shannon’s theorem is fulfilled. The filtered signal is sampled by a floating-point analog-to-digital converter (ADC) [2]. The spectrum is calculated by the Fast-Fourier-Transform (FFT) and weighted by digital detectors like peak, quasi-peak, average or rms. The calculated amplitude spectrum is displayed.
Figure 2. Time-domina EMI measurement system.
SPECTRAL ESTIMATION
Discrete spectral estimation is performed by the Discrete-Fourier-Transform (DFT). A fast algorithm for the computation of the DFT is the FFT. The FFT exploits symmetry and repetition properties and is defined as [7]
where X[k] is the discrete amplitude spectrum of the discrete time signal x[n].
The Short-Time-Fast-Fourier-Transform (STFFT) is defined as an FFT over a limited time-interval. A Gaussian window function w[n] is applied, corresponding to the IF-filter of a conventional measurement receiver. By application of the STFFT, a spectrogram is calculated. The spectrogram is a FFT of a time-interval of the sampled time-domain signal. It depends on the discrete time coordinate of the window and the discrete frequency k. The STFFT is calculated by [7]
DIGITAL DOWN-CONVERSION
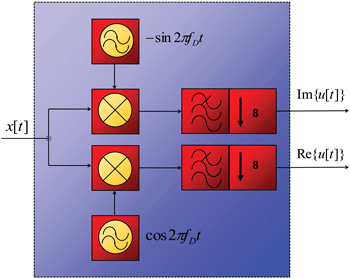
In order to process the signal continuously and to enable the calculation of a real-time spectrogram, the frequency range from DC to 1.1 GHz is subdivided into eight subbands with a bandwidth of 162.5 MHz each. Every subband is digitally down-converted to the baseband and the subbands are processed sequentially [2]. The block diagram is shown in Figure 3. A polyphase decimation filter is used for the inphase and quadrature channel to reduce the sampling frequency and to fulfill the Nyquist criterion. The output sampling frequency is 325 MHz, while the bandwidth is 162.5 MHz.
Figure 3. Digital down-conversion.
Multiresolution Time-Domain EMI Measurement System
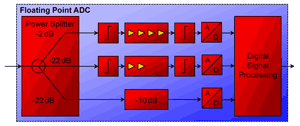
In Figure 4, the block diagram of the floating point ADC, which is comprised of several ADCs, is shown [2]. The input signal is distributed into three channels by an asymmetrical power splitter. Each channel consists of a limiter, a low-noise amplifier, and an ADC. While the first channel digitizes the amplitude range from 0 to 1.8 mV, the third channel digitizes the amplitude range from 0 to 5 V. The second channel is used to digitize the intermediate amplitude range from 0 to 200 mV. The signal is recorded in all three channels simultaneously.
Figure 4. Floating-point analog-to-digital converter.
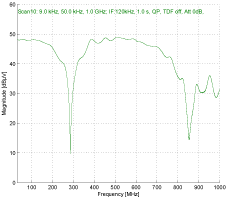
A floating-point representation is calculated from the data of all three ADCs. The values are take in a way that the sample is taken from the ADC that shows the maximum not clipped value. By the multiresolution ADC-system, the necessary dynamic range is achieved to fulfill the requirements of CISPR 16-1-1. In comparison to the requirement for sinusoidal signals, for the measurement of transient signals, the input stage has to handle signals which require additionally 50 dB higher dynamic range, regarding the amplitude range. As an example the notch filter test, as described in CISPR 16-1-1 Section 4.6 has been carried out to verify the spurious-free dynamic range for pulses. A notch filter with an attenuation of at least 40 dB at around 300 MHz was connected to the system input and a pulse generator fed a pulse with a pulse width of 300 ps to the system. The required notch response is 36 dB. According to Figure 5, the time-domain measurement system shows a notch response of better then 38 dB.
Figure 5. Notch filter test.
MULTI-STAGE BROADBAND DOWN-CONVERTER
As illustrated in Figure 2, a multi-stage broadband downconverter was added to enable measurements above 1.1 GHz. For measurements from 1.1-6 GHz, the EMI input signal is down-converted to the range below 1.1 GHz, where it is sampled by the floating-point ADC. The amplitude spectrum is displayed.
For measurements from 6-18 GHz, an additional mixer stage down-converts the input frequency band to the frequency range from 1.1-6 GHz. Subsequently, it is down-converted and processed like described above. A basic prototype of the time-domain EMI measurement system up to 18 GHz was presented in [4]. In comparison, the presented system is fully compliant to CISPR 16-1-1, enabling full compliance measurements from 9 kHz-18 GHz.
1.1 – 6 GHz Down-Converter
Because of the nonlinear characteristics of mixers, a large number of mixing products are generated at its output. These frequencies fIF are determined by [8]
where fRF is the RF input frequency and fLO is the local oscillator frequency.
If only the fundamental frequencies of fLO and fRF are taken into consideration, i.e. m, n = 1, we obtain two frequency components fRF 1,2 according to (3)
The frequency conversion yields two sidebands. The image frequency signal is converted to the same intermediate frequency as the desired signal.
To avoid this, a two-stage mixer system is used in the 1.1 – 6 GHz down-converter [9]. The block diagram of the 1.1 – 6 GHz down-converter is shown in Figure 6. The input band is divided into 14 subbands with a bandwidth of 325 MHz each. Each of those bands is sequentially up-converted to a first high intermediate frequency band which is located above the input frequency band. A second mixer down-converts the IF-band to the range below 1.1 GHz, where it is sampled by the floating-point ADC. A fixed bandpass-filter is sufficiently suppressing the image band, because the input band and the image band do not overlap spectrally. This preselection filter also enhances the spurious-free dynamic range of the system by preventing the LNA and mixers being driven into saturation by high-level narrowband and broadband out-of-band EMI.
Figure 6. 1.1 – 6 GHz down-converter.
6 – 18 GHz Down-Converter
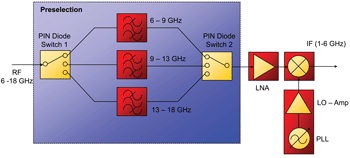
To extend the upper frequency limit of the time-domain-EMI measurement system to 18 GHz, a third mixer stage is added. The block diagram of the 6 – 18 GHz down-converter is shown in Figure 7. For measurements above 6 GHz, the preselection is dividing the input band into three ultra-broadband subbands: band 1 from 6 – 9 GHz, band 2 from 9 – 13 GHz and band 3 from 13 – 18 GHz. The switching between these bands is done via broadband, low-loss, single-input, triple-output (SP3T) PIN-diode switches. These ultra-broadband subbands are consecutively down-converted to the 1.1-6 GHz band via broadband, low-conversion loss mixer and fed to the input of the 1.1 – 6 GHz down-converter.
Figure 7. 6 – 18 GHz down-converter.
HARDWARE IMPLEMENTATION
As most of the EMI in the frequency range above 1 GHz, e.g. higher harmonics of communication systems, is low-level in nature, high sensitivity is mandatory for frequencies above 1 GHz. Increased attenuation of cable assemblies above 1 GHz in common test environments aggravates the problem. A low noise figure of the input stage is critical for high sensitivity. This correlates with a low attenuation of the first stages of the multi-stage broadband down-converter, as (5) for the calculation of the noise figure F of a cascaded system with N stages [10] implies
where Gi is the available power gain of stage i and Fi is the noise figure of stage i.
In the presented measurement system, high-gain, low-noise InGaP/GaAs MMIC preamplifiers yield a system noise figure of around 6-8 dB, rendering the use of external amplifiers unnecessary. To further increase the system’s sensitivity and dynamic range, low-noise double balanced mixers with low conversion loss and high 1 dB compression point are used.
The switching between the bands from 6-18 GHz is accomplished by broadband low insertion loss, single-input, tripleoutput (SP3T) PIN-diode switches. The low diode junction capacitance in reverse polarity yields an excellent isolation of -55 dB to -35 dB in the OFF-state. The switches achieve a low insertion loss of -1.5 dB to -2 dB in the range from 6-18 GHz.
EMISSION MEASUREMENTS
Electric household appliances radiate considerable spectral energy density in the frequency range above 1 GHz. A commonly found example is the microwave oven. A magnetron generates high-power microwave energy at around 2.5 GHz. In order to characterize the radiated emission of a microwave oven, the oven was placed in a full anechoic chamber. An ultra-broadband quad-ridged horn antenna with a bandwidth from 1.7-20 GHz [11] was placed in a distance of 3 m to the device under test. To compensate for cable losses and to give the electric field strength of the EMI, the corresponding transducer factors and the antenna factor were applied.
In Figure 8, the measured emission spectrum from 2-18 GHz is presented. The spectrum shows the magnetron’s strong fundamental at around 2.45 GHz and several higher harmonics up to 18 GHz. The scan time using an IF-filter bandwidth of 9 kHz and a frequency resolution of 50 kHz was around 120 s, while around 320 000 frequency points were calculated.
Figure 8. Emission spectrum of a microwave oven.
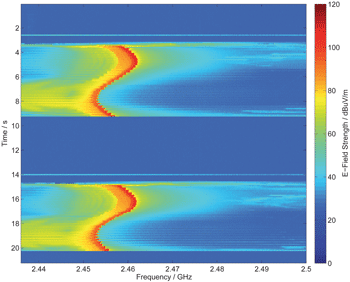
The emission of the microwave oven is not stationary. The amplitude spectrum cannot give any insights into the time-behavior of the radiated emission. The time-domain system’s real-time capability allows for the examination of the time-behavior of the magnetron’s fundamental. The spectrogram is shown in Figure 9. The microwave oven was set to a medium power level, where the magnetron is periodically turning on and off. After a short broadband switching pulse, the magnetron turns on at around 3 s in time and turns off at around 9 s. The magnetron’s output frequency changes by about 10 MHz over this time-period, as the oscillator is freerunning.
Figure 9. Spectrogram of the fundamental of a microwave oven.
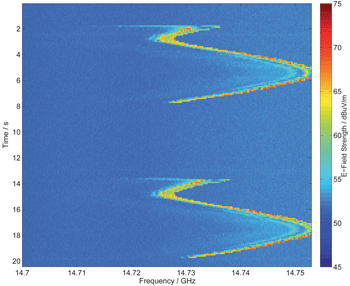
The microwave oven’s magnetron exhibits a non-linear transfer function and therefore, higher harmonics can be seen in the radiated emission spectrum. Figure 10 shows a spectrogram of the microwave oven’s emission at the 6th harmonic, located at around 14.74 GHz. The maximum electric field strength of the microwave oven’s radiated emission is about 70 dBμV/m at this frequency. With its ultra-low system noise floor and the corresponding high sensitivity, the time-domain EMI measurement system is able to measure this low-level emission in real-time.
Figure 10. Spectrogram of the 6th harmonic of a microwave oven.
The frequency shift of the free-running oscillator’s 6th harmonic equals around 60 MHz. The microwave oven’s magnetron can be described as a non-linear system [12]. Thus, the output signal y(t) contains harmonics of the sinusoidal input signal which can be described as
![]() (6)
(6)
The frequency shift of the magnetron’s fundamental resembles a frequency modulation of the output signal y(t) according to
![]() (7)
(7)
Thus, the frequency modulated magnetron’s harmonics can be described as
![]() (8)
(8)
yielding a total frequency shift of
![]() (9)
(9)
for the 6th harmonic.
CONCLUSION
The theory and application of time-domain EMI measurement systems according to CISPR 16-1-1 have been presented. Such measurement systems allow to reduce test time, and to perform investigations of the emission of ISM equipment above 1 GHz. As such emission measurement systems allow for real-time measurements over large frequency bands, the non-stationary behavior of the electromagnetic interference can be measured and weighted.
REFERENCES
[1] CISPR 16-1-1, Ed. 3.1 Am. 1, “Specification for Radio Disturbance and Immunity Measuring Apparatus and Methods Part 1-1: Radio Disturbance and Immunity Measuring Apparatus – Measuring Apparatus,” International Electrotechnical Commission, 2010.
[2] S. Braun, T. Donauer, and P. Russer, “A Real-Time Time-Domain EMI Measurement System for Full-Compliance Measurements According to CISPR 16-1-1,” IEEE Transactions on Electromagnetic Compatibility, Vol. 50 No. 2 May 2008: 259 – 267. Print.
[3] CISPR 11, Ed. 5.1, “Industrial, Scientific and Medical Equipment –Radio-Frequency Disturbance Characteristics – Limits and Methods of Measurement,” International Electrotechnical Commission, 2010.
[4] C. Hoffmann, S. Braun, and P. Russer, “A Broadband Time-Domain EMI Measurement System for Measurements up to 18 GHz,” EMC Europe 2010, Wroclaw, Poland, pp. 34 – 37, 2010. Print.
[5] C.R. Barhydt, “Radio Noise Meter and its Application,” General Electric Rev., Vol. 36 1933: 201-205. Print.
[6] K. Hagenhaus, “Die Messung von Funkstörungen,” Elektrotechnische Zeitschrift, Vol. 63 1942: 182-187. Print.
[7] J. G. Proakis, and D. G. Manolakis, “Digital Signal Processing, Third Edition,” Pearson Prentice Hall, 1996. Print.
[8] G. D. Vendelin, A. M. Pavio, and U. L. Rohde, “Microwave Circuit Design using Linear and Nonlinear Techniques, Second Edition,” John Wiley & Sons, 2005. Print.
[9] S. Braun, C. Hoffmann, and P. Russer, “A Realtime Time-Domain EMI Measurement System for Measurements above 1 GHz,” IEEE EMC Society Symposium on Electromagnetic Compatibility, Austin, USA, 2009.
[10] W. B. Davenport, and D. L. Root, “An Introduction to the Theory of Random Signals and Noise,” John Wiley & Sons, 1987. Print.
[11] RF Spin, “Broadband Quad-Ridged Horn Antenna QRH20,” Data Sheet.
[12] W. Sansen, “Distortion in Elementary Transistor Circuits,” IEEE Transactions on Circuits and Systems II: Analog and Digital Signal Processing, Vol. 46 No. 3 March 1999: 315 – 325. Print.
Christian Hoffmann was born in Ulm/Donau, Germany. He received the Dipl.-Ing. degree in Electrical Engineering from the Technische Universität München (TUM), Munich, Germany, in 2008. He is currently working towards the Dr.-Ing. degree at the Institute for High-Frequency Engineering at TUM, Germany.
His research interests include measurement techniques in the microwave and millimeter wave regime, microwave and millimeter wave passive and active circuits and digital signal processing. His research is focused on the investigation of electromagnetic compatibility in time-domain above 1 GHz. Hoffmann is a member of the IEEE and VDE.
Stephan Braun studied Electrical Engineering at Munich University of Technology (TUM), and received his Dipl.-Ing. Degree in 2003. From 2003-2009 he was research assistant at the Institute for High-Frequency Engineering, where he received his Dr.-Ing. degree in 2007. Dr. Braun is now managing director of GAUSS Instruments. His research interests are EMC and microwave measurement technology, as well as RF-circuits and digital signal processing. Further interests are fast digital circuits and configurable digital logic. Dr. Braun is Member of the VDE and IEEE. He is the author of more than 50 papers and inventor of several patents.
Arnd Frech was born in Bruchsal, Germany, in 1981. He studied electrical engineering at the Technische Universität München (TUM), Munich, Germany with focus on high-frequency engineering and electronic systems. He received the Bachelor of Science and the Dipl.-Ing. degree both from the Technische Universität München in 2005 and 2006, respectively. After finishing his diploma thesis in the field of near-infrared spectroscopy at the Swiss Federal Institute of Technology, Zurich, Switzerland, he joined the Institute for High-Frequency Engineering at the Technische Universität München as a research assistant working towards the Dr.-Ing. degree. He is co-founder and managing director of GAUSS INSTRUMENTS GmbH, working in the field of EMC and RF measurement instrumentation and high-speed digital signal processing.
Peter Russer received the Dipl.-Ing. (M.S.E.E.) degree in 1967 and the Dr. techn. (Ph.D.E.E.) degree in 1971, respectively, both from the Vienna University of Technology, Austria. In 1971 he joined the Research Institute of AEG-Telefunken in Ulm, Germany. With his research group he realized in 1978 the first optical fiber transmission link for 1 Gbit/s worldwide. From 1981 to 2008, Russer was professor and head of the Institute for High Frequency Engineering at the Technische Universität München, Germany. From October 1992 to March 1995, he was director of the Ferdinand-Braun-Institut für Höchstfrequenztechnik, Berlin. From 1997 to 1999, Russer was dean of the Department of Electrical Engineering and Information Technology of the Technische Universität München. In 1990, he was visiting professor at the University of Ottawa; in 1993 he was visiting professor at the University of Victoria and from August to October 2009 he was visiting scientist at the Institut Supérieur de l’Aéronautique et de l’Espace in Toulouse.

