Janusz Baran, Częstochowa University of Technology, Częstochowa, Poland, Jan Sroka, Warsaw University of Technology, IETiSIP, Warsaw, Poland
Abstract
Simulation of the human-metal electrostatic discharge alters slightly from one to another standard. As a result, setups with different frequency bandwidth are required for the calibration of the ESD simulators. The rule of thumb that is valid for the trapezoidal sequence of pulses (reciprocal of the product of π and rise time) for determining the bandwidth gives the underestimated result. The authors propose another sophisticated rule of thumb. It is crossing point of the power spectral densities (PSD) of the theoretical pulses with noise level of the measurement path. According to this rule, bandwidth required in the IEC standard is wide enough but it is to narrow in the ANSI standard and in consequence in the MIL-STD.
Electrostatic discharge (ESD), Frequency domain analysis, Power Spectral Density (PSD)
I. INTRODUCTION
The subject of this paper is the consideration of the frequency bandwidth of the Human-Metal Electrostatic Discharge. We will study how this phenomenon is dealt with in standards issued by three institutions: the International Electrotechnical Commission (IEC), the American National Standards Institute (ANSI) and the U.S. Department of Defense (MIL-STD).
During verification of ESD simulators the current pulse of so called contact discharge is recorded in the time domain. There are measured the following metrics specified by the standard: the first peak, (10%-90%) rise time and “tail currents” in 30ns and in 60ns.
The information about the frequency bandwidth of the discharge current is crucial for the choice of proper calibration setup for trustworthy verification of the simulators. The key metric with respect to the frequency bandwidth is the rise time. In IEC Standard [4] it is 800ps. In ANSI standard [1] it is less than 400ps. The MIL-STD [2] refers to [1] .
The question whether frequency specification of a setup ensures trustworthy verification of the pulse in the time domain is justified, but it is difficult to resist the impression that in the past the answer on this question has been dictated by capabilities of single shot digital oscilloscopes available on the market. On the other hand sometime an end of this trend should be eventually reached. The paper summarizes our research work in this subject.
II. MODEL OF THE PHENOMENON
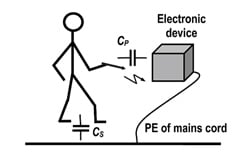
The human-metal electrostatic discharge (ESD) can take place when a charged person holding a pointed metal object, like a screwdriver or a ballpoint pen, rapidly moves the hand against an electronic device (Figure 1).
Figure 1. Human-Metal Electrostatic Discharge [6].
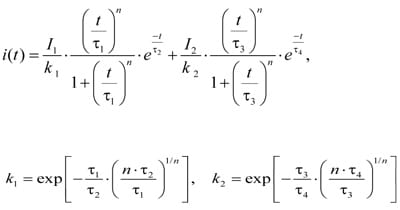
According to standard [4], an idealized discharge current pulse can be described analytically using the formula:
Corresponding parameter values are gathered in Table I. The values of I1 and I2 are for 4 kV static charge voltage. We will name this pulse the nominal IEC pulse.
Table I. Parameters of the nominal IEC pulse.
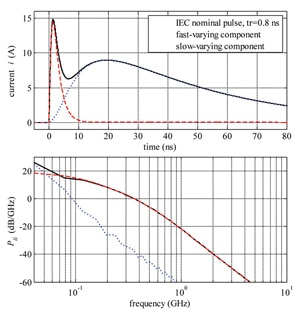
Two components of the current can be distinguished in the ESD phenomenon. The fast-varying component, represented by the first summand in (1) and the dashed red line in Figure 2.a, is due to arc discharge of a small capacitance Cp between the metal tip and the device. The slow-varying component, represented by the second summand in (1) and the dotted blue line in Figure 2.a, results from discharge of a larger body capacitance Cs. The rise time of the nominal pulse (1) is equal to 0.8ns.
Figure 2. IEC nominal pulse and its components by 4kV: a) in the time domain [6], b) power spectral density (PSD).
In [6] the authors used the power spectral density (PSD) for frequency representation of the ESD pulse. The PSD of a signal is the squared magnitude of its Fourier transform. For a sampled signal x(n) it can be calculated as:
where X(ω) is the N-point fast Fourier transform of x(n), X*(ω) is the complex conjugate of X(ω) and fs is the sampling frequency. The authors chose the PSD, because it is the most common tool used in statistical signal analysis for description in the frequency domain. The PSD is a real positive function and has clear interpretation: power of a signal per unit frequency. The estimates of the PSD spectra in Figure 2.b and further were computed using the Welch method (Matlab Signal Processing Toolbox function pwelch): the total number of data samples (N=2000 for 100 ns recording range and fs=20 GHz), was divided into 4 or 8 overlapping segments and the FFTs of the segments, windowed with the Hanning window to reduce effects of discontinuities at the segment ends, were averaged.
The power spectral densities (PSD) of the theoretical nominal pulse and its fast and slow varying components are shown in Figure 2.b.
III. VERIFICATION OF THE ESD SIMULATORS
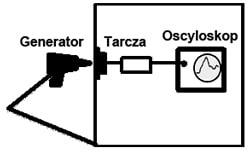
According to [1] and [4] calibration setups are identical. The discharge current is verified in contact mode. The setup consist of the current transducer (target), attenuator, coaxial cable and single shot wideband oscilloscope. The target is mounted in the wall of the faraday cage. All other components are placed inside the cage (see Figure 3).
Figure 3. Calibration setup for verification of the ESD simulators.
The most crucial factor for trustworthy verification of the pulse metrics are the frequency bandwidth of the target and the oscilloscope. They must be wider than the bandwidth of the phenomenon itself. If it is narrower then the bandwidth of the instrumentation then simple low frequency approach can be applied. If it is not the case, then distortion due to frequency characteristics of the instrumentation must be considered as well. It has an impact on recalculation of the registered voltage to the discharge current and on complexity of estimation of the measurement uncertainty.
IV. TOLERANCE OF THE PULSE METRICS
A. IEC pulse
The rise time tolerance defined in [4] is ±25%. It means that the fastest allowable pulse has 0.6ns rise time, and the slowest 1.0ns. We will name them the fast and the slow IEC pulse respectively. They can be modeled by formula (1) with modified values of parameters τ1 oraz /1 i.e. τ1=0.67 ns /1=10.2 and τ1=1.6ns i /1=18.5A respectively and the other parameters as in Table I.
Table II. Metrics of the nominal IEC pulse by 4kV static charge voltage [4].
B. ANSI pulse
Table III. Metrics of the slowest ANSI pulse by 4kV static charge voltage [1].
In [1] the pulse is defined in another way. There is requirement imposed on the rise time: it should not be bigger than 400ps. We will name such a pulse the slow ANSI pulse. This pulse is represented with formula (1) with parameters gathered in Table IV.
Table IV. Parameters of the slow ANSI pulse.
The typical ANSI pulse (300ps) can be modeled by formula (1) with changed values of τ1=0.26ns and I1=21.6A and the remaining parameters as in Table IV.
V. ESTIMATION OF THE REQUIRED BANDWIDTH
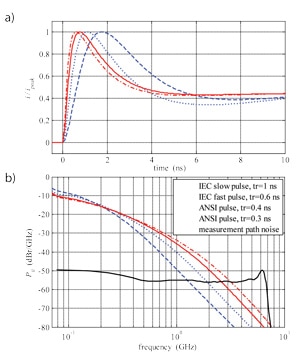
For the sake of comparison the four considered pulses i.e.: the slow and fast IEC pulse and the slow and typical ANSI pulse are normalized with respect to the peak current, so that all are dimensionless and have the unit maximum. They are presented in the time domain in Figure 4.a.
In [6] the PSD of the measurement data from the round robin test summarized in [5] are calculated. The measurement by round robin test were performed using a setup with an oscilloscope with 6GHz analogue bandwidth and with 20GS/s sampling rate and a target with flat frequency characteristic up to 4GHz as required in [4]. Such a bandwidth is wide enough for trustworthy verification of simulators. Innovatory in [6] is calculation of the noise of the measurement path including the simulator.
We propose to use the frequency at which the PSD of the pulse and the noise level cross as simple estimator of the minimal required bandwidth of the setup. These point are marked with circles in Figure 4.b. Such a choice is justified because on the right side of a crossing point the power of a pulse is smaller than the power of the noise. As it is reported in [6] the bandwidth of a “smooth” real pulse is about the same as the bandwidth of a theoretical pulse. Therefore this criterion can be extended on real pulses, unless they are very “rough”.
Table V. Assembly of required bandwidth vs. rise time.
Figure 4. Normalized pulses in the time domain (tr – rise time) a), and in the frequency domain along with the PDS level of the noise b).
VI. CONCLUSIONS
The rise time metric of the ESD pulses changing from standard to standard implicates different bandwidths of a calibration setup. In particular it concerns the choice of a current transducer and an oscilloscope.
As it is shown in [6] the rule of thumb valid for trapezoidal sequence of pulses which sets the corner frequency , fB=1/( ∙ tr) (reciprocal of the product and rise time) for determining the bandwidth gives the underestimated result. We propose another, more sophisticated “rule of thumb” based on comparison of the PSD of a theoretical pulse and the noise level. The frequency above which the pulse spectrum descends below the level of the noise provides a trustworthy hint for required minimal bandwidth of a verification setup.
We have left out discussion on the furniture discharge defined in [1] and the pulse for testing electronic microcircuits [3] because these pulses are much slower and therefore irrelevant in frequency consideration.
The results given in Table V show that the oscilloscope bandwidth required in standard [4], at least 2GHz is sufficient for the IEC pulse. On the other hand 1GHz oscilloscope bandwidth required in standard [1] is too narrow for correct, trustworthy verification of the ANSI pulse. This conclusion refers also to ESD testing according to MIL standard [2].
The advantage of knowing the ESD bandwidth is straightforward. If bandwidth of the measurement instrumentation is bigger than ESD bandwidth, then the recalculation of the voltage recorded by an oscilloscope to the original current pulse is simply multiplying by a real frequency independent constant factor. Moreover, estimation of uncertainty in that case is very simple. However, if the pulse spectrum of a verified generator is comparable with the frequency bandwidth of a setup, the high frequency considerations by pulse recalculation and by measurement uncertainty estimation are necessary.
REFERENCES
[1] American National Standard. Guide for Electrostatic Discharge Test. Methodology and Criteria for Electronic Equipement, ANSI C63.16, Nov. 1993.
[2] Electrotatic Discharge Control Program for Protection of Electrical and Electronic Parts, Assmblies and Euipment (Excluding Electrically Initiated Explosive Devices), MIL-STD-1686C, Oct. 1995.
[3] Test Method Standard Microcircuits, MIL-STD 883-6G, Febr. 2006.
[4] Electromagnetic compatibility (EMC) – Part 4-2: Testing and Measuring Techniques – Electrostatic Discharge Immunity Test, IEC 61000-4-2, Dec. 2008.
[5] J. Koo, Q. Cai, K. Wang, J. Maas, T. Takahashi, A. Martwick, D. Pommerenke, “Correlation Between EUT Failure Levels and ESD Generator Parameters”, IEEE Trans. EMC, Vol. 50, No. 4, pp. 794-801, Nov. 2008.
[6] J. Baran, J and J. Sroka: “Distortion of ESD Generator Pulse Due to Limited Bandwidth of Verification Path” IEEE Trans. EMC, Vol. 52, No. 4,
1. In [1] also a „chair discharge” due to metallic mobile furnishings like cart or chair is defined. Its rise time is however bigger than 1ns and therefore out of interest in this aspect.
2. There is another MIL-STD [3] for testing electronic microcircuits components in unenergized conditions. The rise time of this pulse can be up to 10ns and therefore it is out of interest in this aspect.
3. In [4] four different severity levels are defined. As example only level 2 by 4kV static charge voltage is cited here.
* This paper was presented at the European EMC Symposium York’2011
