INTRODUCTION
This article describes the lack of an acceptable correlation between anechoic chamber and open field test site radiated emission measurements, which were described in reference 1 in 2000, as well as a lack of correlation between chambers. It was found that emission measurements, which were over the limits in one facility, would pass in another.
The lack of a good correlation between OATS and chamber measurements and between chambers means that manufacturers may be over designing equipment for EMC, or equipment is passing radiated emissions at one site but would fail at another.
Although this would appear to be of great interest to manufacturers, up until now this has not been the case. It is not surprising when a manufacture tries a different facility for radiated emission or susceptibility (immunity) measurement in the hope that the equipment will pass in the second facility, where resonances may be lower or at different frequencies.
CASE STUDIES
The report in reference 1 report compared the test results over the 212 to 236 MHz frequency range between a 3m OATS, a 3m anechoic chamber, and a 10m OATS. The same EUT was tested on all sites and it was determined that, although often a determining factor, the cable orientation was not the cause of the large variation which was seen.
The Normalized Site Attenuation (NSA) of the 3m OATS in Reference [1] was measured from 200 to 300 MHz and the variation was 0.31 to 1.9 dB. Whereas the difference in measured level between the 3m anechoic chamber and the 3m OATS was as high as 14 dB. At some frequencies emissions were seen at one site and not at another and ambients were ruled out. This represented an error of up to 25 dB!
In radiated emission measurements on the aforementioned 3m OATS at 10m, reported in Reference [2] in 2010, the EUT manufacturer’s customer had the same EUT measured in a 3m semi anechoic chamber with a very high 26.8 dB variance between the OATS and the chamber. Table 1 shows the difference in measured levels between the OATS and chamber and it can be seen that the emissions were much higher in the chamber at some frequencies. Also some levels measured on the OATS were not seen at all in the chamber, indicating a frequency where the fields inside the chamber cancel.

Even when the EUT was measured on a second 10m OATS, with a good correlation to the first 10m OATS, the customer insisted that the measurements made in the chamber were correct. The manufacture had to achieve emissions 6dB below the limit and so a massive margin was required in order to get the equipment to pass the customers measurement in the semi-anechoic chamber. This resulted in added engineering and manufacturing cost to the manufacturer. It also added the frustration in knowing that the EUT had almost certainly passed the requirements and a delay due to numerous levels of re-engineering.
OATS AND CHAMBER NORMALIZED SITE ATTENUATION CALIBRATION
ANSI C63.4 defines the theoretical normalized site attenuation (NSA) for site validation. The requirement is met when measurements show that the site NSA is within the range of +/-4 dB of the theoretical. The antenna calibration method may affect the antenna calibration and therefore the NSA value. ANSI C63.5:2006 is cited in ANSI C63.4:2014 as the only permissible antenna calibration standard which includes requirements for antennas used for NSA measurements. Antenna uncertainty values may result in not achieving the required +/-4 dB range but not the huge variation between some semi anechoic chamber and OATS measurements.
ANSI C63.4 describes the standard OATS as well as alternative test sites which include RF absorber lined metal test chambers (semi-anechoic chambers), office or factory buildings, and weather protected OATS with covering structures. These alternative test sites shall comply with the volumetric NSA requirements of the standard over a volume occupied by the EUT, or the EUT arrangement. Thus the NSA measured on the OATS and the anechoic chamber measurements over this volume should be comparable, which is often not the case.
POSSIBLE SOURCES OF ERROR
The cable orientation and time spent in maximizing cable emissions plays a role but surely not to the extent of 25 and 26.8 dB as in the two examples. Also at high frequency where emissions may be sourced by seams in the enclosure the speed of the turntable does plays a role in detecting the emissions which occur over a narrow beam width.
The correction of 10.5 dB in going from a 10m to a 3m measuring distance is also not always correct, especially for large EUTs. Some test facilities make radiated emission measurements to commercial requirements, such as FCC Part 15 and EN55022, on class A equipment in a 3m chamber and then make the correction to 10m with a possible error.
CHAMBER RESONANCES
The major source of variation in anechoic chamber measurements is chamber resonances resulting in variation in the electric field level within the chamber.
The chamber is an enclosed box with reflective surfaces in which any electromagnetic wave bounces back and forth inside it, several resonant modes are generated and energy is stored within the chamber. These resonant modes generate standing waves and minimums and maximums in the field occur depending on frequency and location within the chamber. At resonance the field within the room may be higher than the field generated by the source in an open area test site. Several resonant modes may occur and when the room is lined with absorber these resonances are partially attenuated by the absorber.
ABSORBER
Likewise with absorber the reflections within the room are partially damped. However the attenuation due to the absorber is limited.
The absorber inside the room has to be effective enough to achieve the NSA requirement. The NSA calibration is made at the frequencies shown in Table 2.
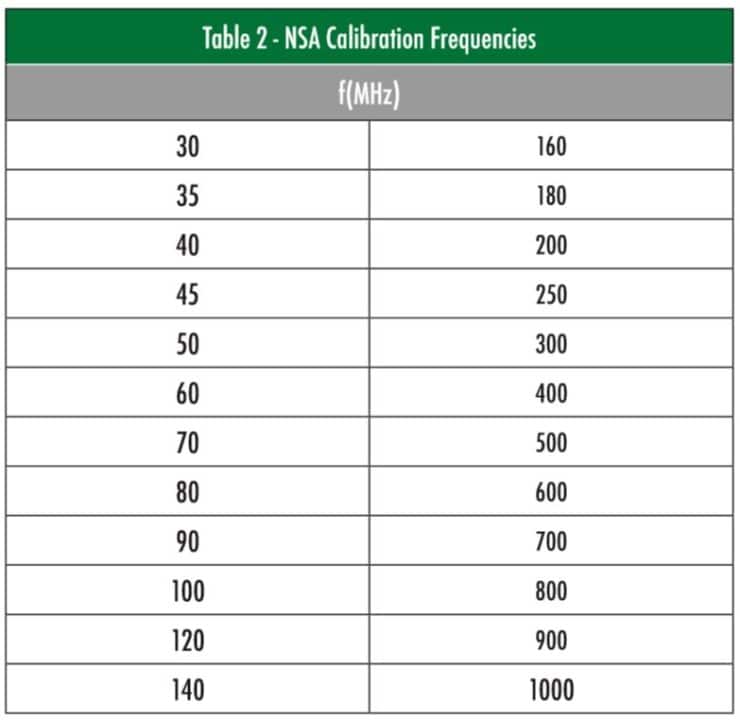
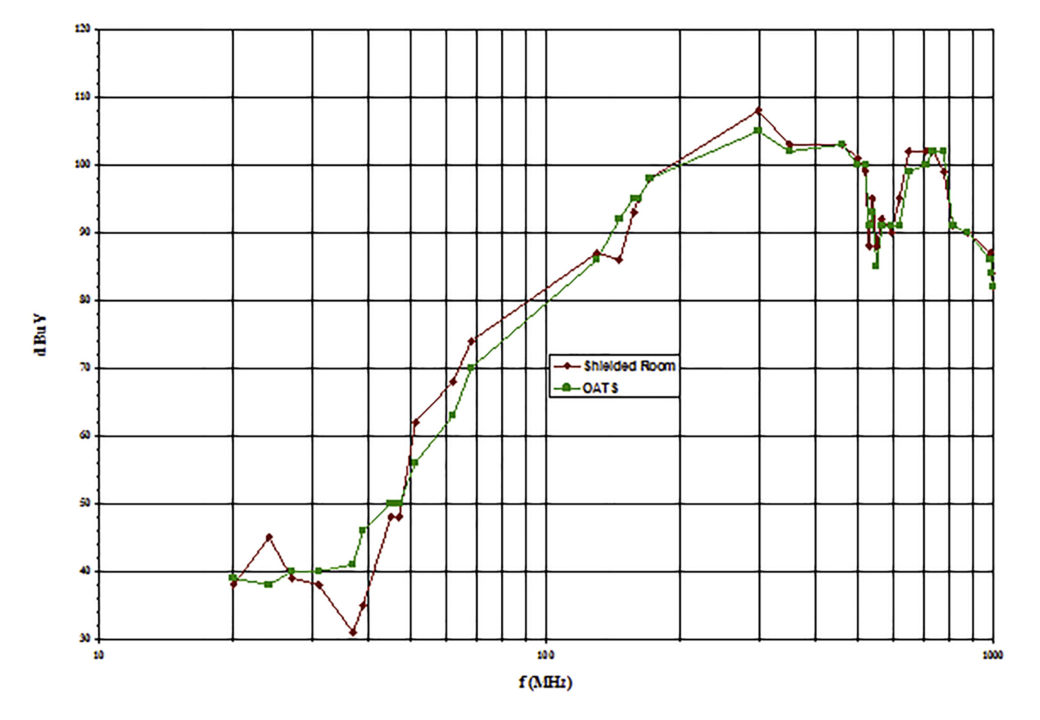
The interval between frequencies is acceptable for testing on an OATS but we see that a typical resonance in a room covers only approximately 4 MHz, from Figure 1, and so in performing the NSA test any resonance may be missed if this falls between the spot frequencies tested for NSA.
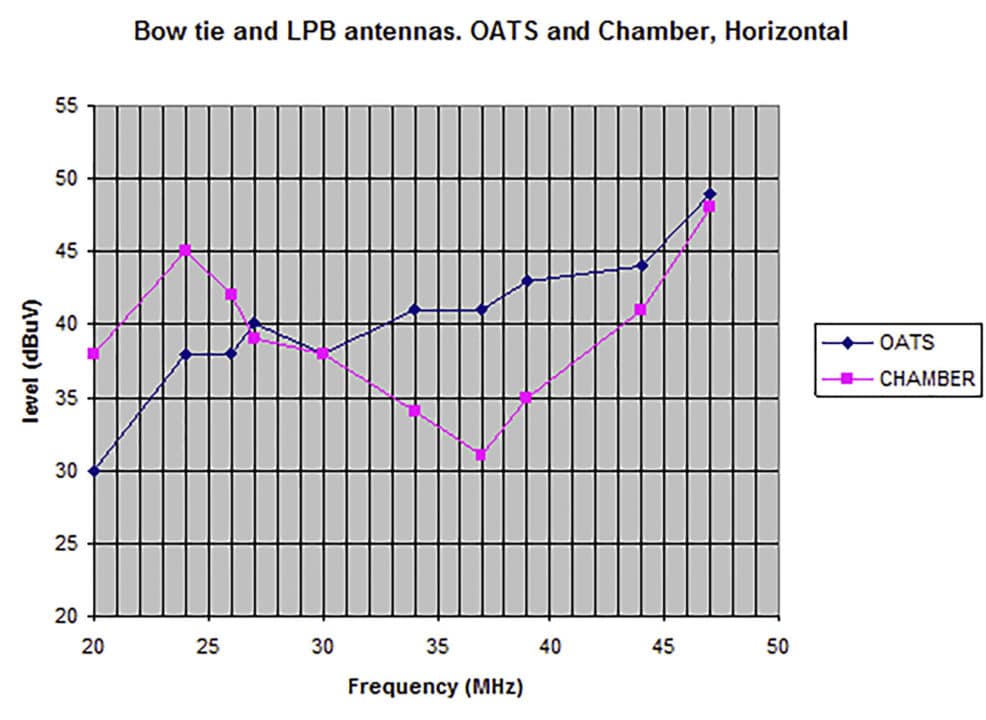
Figure 1 shows the correlation between 20 MHz and 1 GHz and Figure 2 is a close up of the resonances for a horizontally polarized field from 20 to 44 MHz.
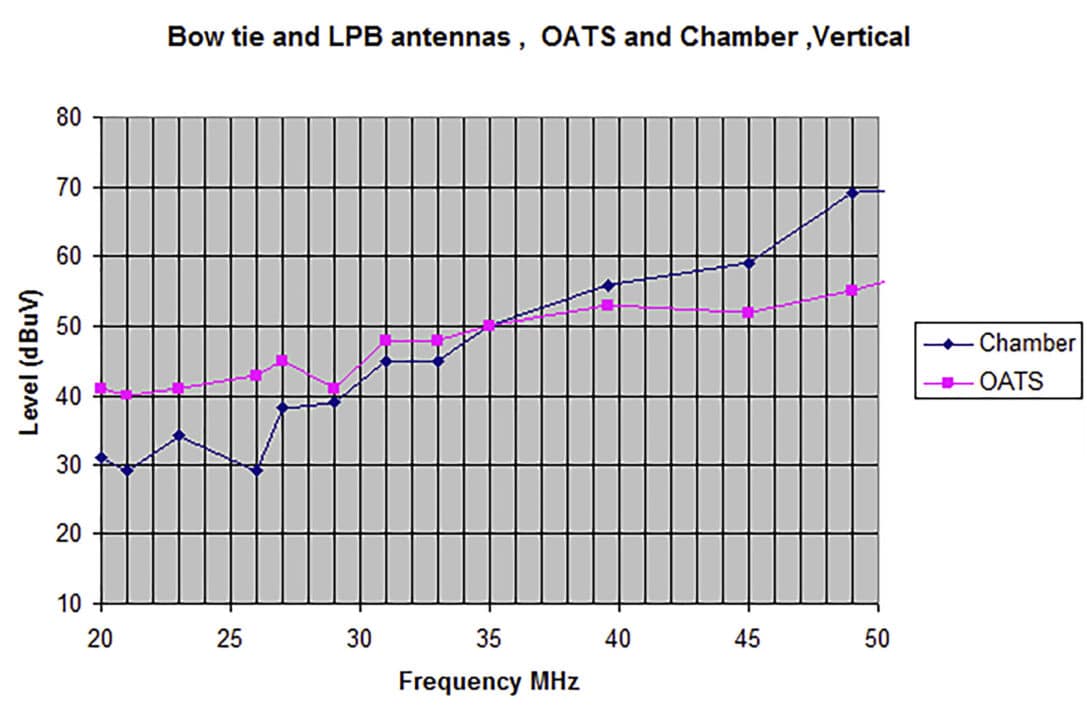
We saw that the field polarization affected the room resonance and Figure 3 shows the correlation for a vertically polarized field from 20 to 50 MHz.
TYPE OF ABSORBER
The type of absorber plays a large role in damping the resonances as seen in Reference [3]. Reference [3] identifies the influential parameters in CISPR 25 radiated emission setup. CISPR 25 is the reference standard in the automotive industry for performing measurements in a semi-anechoic chamber. Unlike other commercial radiated emission measurement, but similar to a MIL-STD-461 type test, the EUT is placed on an elevated ground plane connected to the chamber wall. Significant differences were seen between CISPR 25 compliant laboratories when measuring emissions on the same device under test. The paper makes an inter laboratory comparison across 17 laboratories with a special focus on the 30 to 100 MHz frequency range. A three dimensional model of the semi anechoic chamber was built and validated to analyze the influence of each of the parameters of the room and provide a reference for the measurements in the laboratories.
CISPR25 requires that the material absorption performance shall be greater than 6dB in the 70 to 2500 MHz frequency range. In a 5.33 x 6.53 x 3.63m chamber the first cavity resonance is at 36 MHz and so the absorber type used is important over the 30 to 100 MHz frequency range.

These absorbers include ferrite tiles, foam absorbers, or hybrids (a combination of ferrite tiles and absorber which are matched). The ground plane in the CISPR 25 room can be connected either horizontally to the chamber wall or vertically to the floor ground plane. Reference [3] shows a -20 to + 10 dB variation between the two grounding techniques with the greatest variation seen with a vertical grounding. In a room without a ground plane this affect is not seen and it is the absorber type, which is important. Measurements on foam pyramidal absorber and hybrid show the reflectivity of the two, a comparison of which is shown in Table 3.
It is surprising that the foam absorber performance at 200 MHz is better than the hybrid, perhaps indicating that the matching of the ferrite and foam is not ideal. When designing a room, such as shown in Figure 4 with foam mounted on top of ferrite tile, the manufacturer of both types of absorber recommended the types of absorber which were compatible. The effect of the absorber type alone can be extracted from the data for horizontal ground plane connection from Reference [3].
In order to perform the inter-laboratory measurements between 17 laboratories, a reference was developed based on simulation with perfect absorbers and with a 1 x 2.5m elevated ground plane. This reference provides a theoretical maximum and minimum for the absorber types. Over the 5 to 84 MHz frequency range, the maximum variation in measurement results was 15 dB. For the measurements in the chambers a comb generator was used as the source of radiation.
Reference [3] show a plot of the field measured from this source from the 17 laboratories compared to the reference. This plot shows that the largest variation from the reference level was with rooms, which contained only pyramidal foam absorber. This variation was a worst case 34 dB at 20 to 26 MHz with the measurements from rooms with a hybrid absorber lying within the predicted maximum and minimum levels. Thus, based on the measurements the worstcase difference in radiated emission measurements between any two rooms was 22 dB.
Another technique used to achieve the results shown in Figure 1 and described in Reference [4], adds absorber loads placed in the room at strategic locations as well as a compatible combination of ferrite tiles with foam absorber on top, as shown in Figure 4, resulting in a very well damped room.
METHODS OF DETERMINING CHAMBER RESONANCES
1) Antenna input power to develop a constant E-field level.
As the gain of the transmitting antenna and Antenna Factor (AF) of the receiving antenna are dependent on frequency, these factors must be corrected for when calculating the required input power for a given E-field at a specific frequency. A field uniformity test was performed to see if this could be used to identify a standing wave as it is expected that the E-field would vary significantly across the chamber. As these tests are typically performed above 80MHz the low frequency resonances shown in Figures 2 and 3 would not be detected.
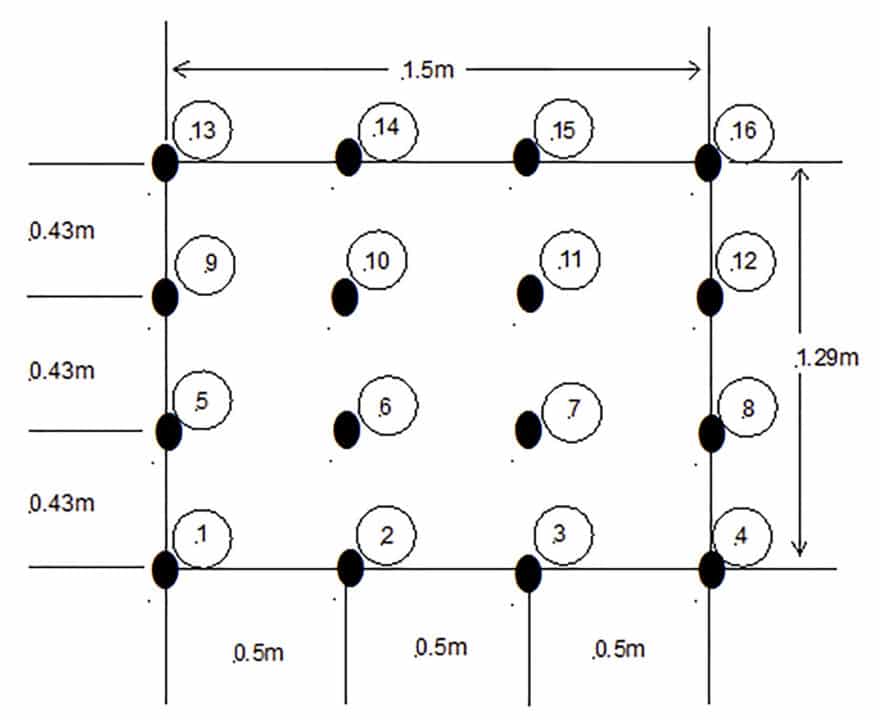
The field uniformity was tested over the area seen in Figure 5. From 80 to 200 MHz, a biconical antenna was used as the transmitting antenna but at a distance of 1m from the receiving antenna it was found that the field from the antenna was not sufficiently uniform. Instead an 80 MHz to 1 GHz double-ridged guide antenna was built which provided acceptable uniformity from the antenna at 1m when measured on the free space range.
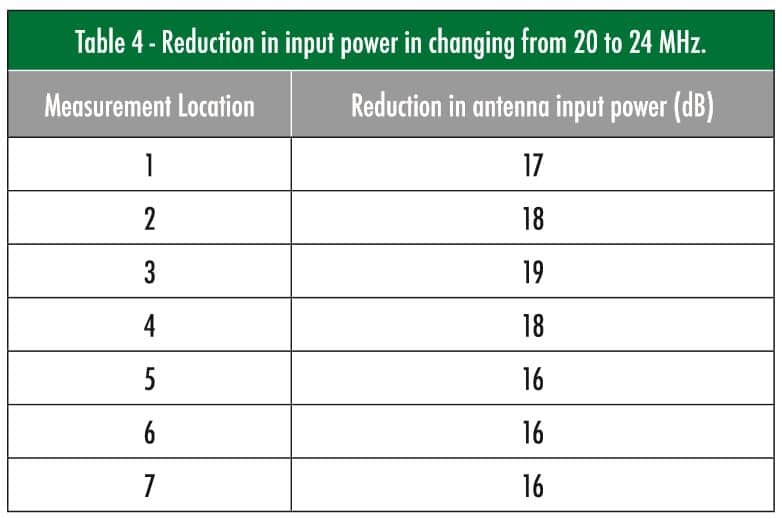
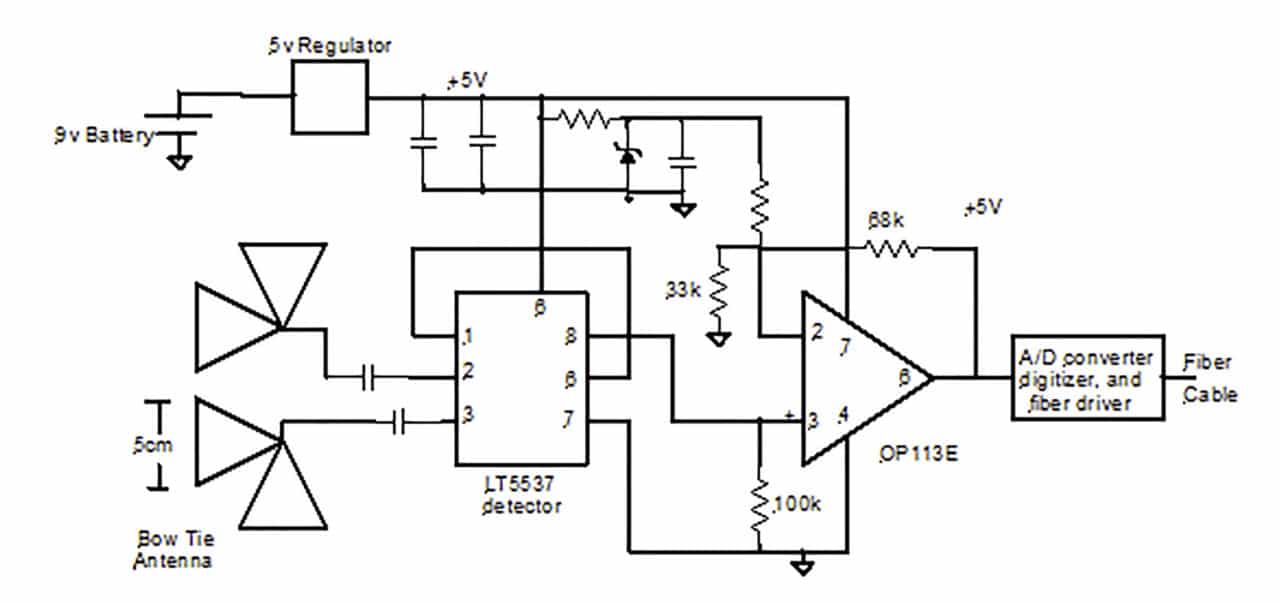
The test in the chamber did not show any large variation in field level over the area of test, which is not surprising as Figure 1 shows a good correlation to the OATS above 50 MHz. As the room resonances are at frequencies below 80 MHz a monopole was used as the transmitting antenna and a small isotropic antenna, shown in Figure 4 connected to a detector, digitizer and fibre optic driver was used as the receiving antenna as shown in Figure 6. As the detector has a logarithmic response the level of E-field was adjusted to be just above the noise floor for maximum sensitivity. The transmitting antenna input power was then adjusted so that the digital number read over the fibre optic link was constant and therefore the E-field was constant. At 24 MHz a room resonance is seen and indeed the level of input power required for a given E-field level is lower than at 20 MHz. The field was measured at locations 1 to 7 in Figure 5 and the reduction in input power required for a constant E-field is shown in Table 4.
When using antennas with a linear frequency response to the field, monitoring the E-field at a constant input power will show either an increase in the level of E-field or a decrease, and so after corrections for gain and AF, the resonance frequencies can be determined. The level of E-field is dependent on location and is typically different for vertically and horizontally polarized fields.
2) Comparison between free space range and chamber tests 20 to 50 MHz
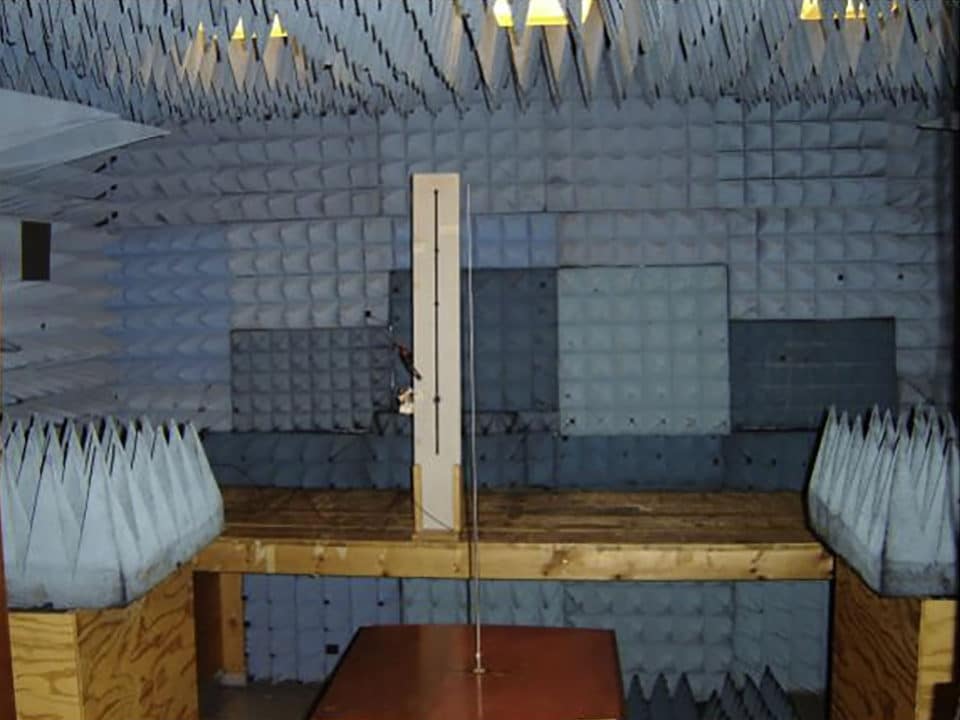
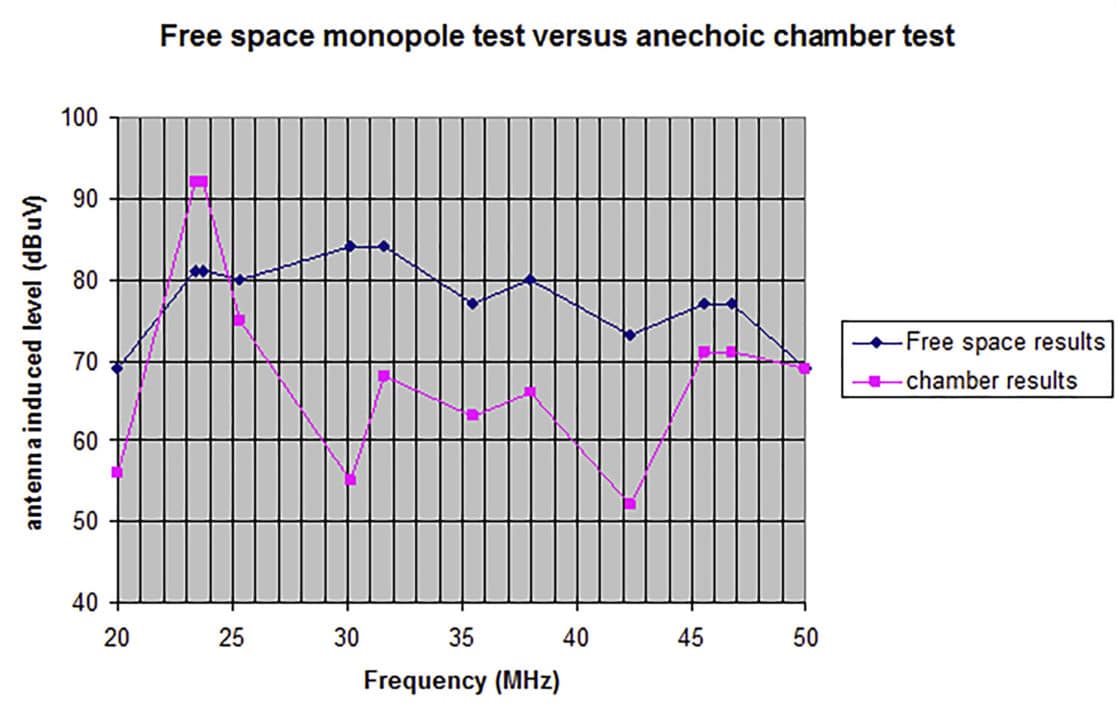
The small monopole antenna was used to generate the E-field and a 1m rod monopole antenna was used as the receiving antenna. The fields generated were thus vertically polarized. The measurements were made with the antennas 1m apart on a free space range as well as the anechoic chamber. The same cables and signal source were used in both tests and the signal source was located on the ground and covered in a ferrite tile to reduce the impact of the proximity of the signal generator’s metal enclosure on the measurement. The ground plane in the chamber was covered in ferrite tiles.
A comparison of the free space results and the chamber results are shown in Figure 7. A maximum at 23.7 MHz and a minimum at 30.2 MHz and 42.3 MHz can be seen from the plot.
At 23.7 MHz the measured field is 11 dB above the free space measurement and at 30.2 MHz the level is 29 dB lower. Thus, this measurement can be used to identify chamber resonances.
CONCLUSIONS
1) Errors detected
The huge variances seen in the OATS to chamber measurements of 25 dB and 26.8 dB were not seen in the measurements on 17 chamber reported in Reference [3] but a maximum variation of 22 dB was seen due to the different absorber used. It is possible to attribute the 26.8 dB difference to chamber resonance and poor absorber performance. There may be a simple alternative explanation, however the customer was not willing to make an investigation as he believes his results in the 3m chamber were correct. One facility reported a difference of 20 dB over the entire frequency range between measurements on an identical Equipment Under Test (EUT) compared to our measurements. The facility was requested to connect a signal generator to the spectrum analyzer input and indeed the spectrum analyzer measured a 20 dB higher signal than the input level. The spectrum analyzer contained a 20 dB preamplifier, which had been in circuit unknowingly from the day the instrument had been bought! This is most unusual as most instruments automatically correct the displayed level when an internal preamplifier is switched in circuit. If an external preamplifier is used then this may be forgotten in the calculation of the raw data to corrected data.
An error of this type could not be the explanation for the 26.8 dB difference as this positive difference should be seen at all frequencies. Also, it goes without saying that cable attenuation should be a part of the data correction, but would only reduce the measured level by a few dB.
2) Mitigation
Reference [3] does show that a facility with hybrid absorbers exhibits lower resonances than chambers with only foam pyramidal absorbers and so when choosing between facilities this should be a strong contributing factor.
A chamber may be selected before qualification testing by using the monopole antennas, as described, to make a free space or OATS measurement and repeating this in the chamber. Resonance frequencies may be identified in the difference between the measurements. If a free space measurement cannot be performed then an electromagnetic computational program may be used to predict the coupling between the two antennas. However it is important to adequately model the transmitting and receiving antenna cables in the analysis.
REFERENCES
[1] Lack of standardized testing leads to widely varying measurements at different commercial test sites, D. Weston. NARTE News, Volume 18, Fall 2000.
[2] Egregious errors in electromagnetic radiation evaluation, D. Weston, Interference Technology, 2010 EMC Directory & Design Guide.
[3] Identification and Study of Influential Parameters in CISPR25 Radiated Emissions Test Setup by Inter-laboratory Measurements and 3-D Simulation Combined Analysis, Frederic Lafon, Renaud Dupendant, Josselin Davalan and Candice Chevriau. IEEE Transactions on Electromagnetic Compatibility, Vol. 58, No. 5, October 2016.
[4] Electromagnetic Compatibility Methods, Analysis, Circuits, and Measurements, Third Edition, D. A. Weston. CRC Press, 2015.
