The shunt capacitor is the critical element in almost all low pass filters. Feed-through capacitors are configured as a center electrode passing through a grounded housing, which contains the desired capacitance from the electrode to the grounded housing, and practically eliminates lead inductance. This article will explain the importance of feedthrough capacitors, and provide improved methods for testing the high frequency performance of these critical components. Testing the insertion loss performance of feedthrough capacitors in a repeatable fixture is necessary to evaluate components for design, application qualification, and incoming inspection or quality audits. High current and high performance filters represent unique challenges for component testing. High current here refers to current ratings of significantly over 30 Amperes, up to and exceeding 400 Amperes. High performance generally refers to insertion losses of greater than 30dB at frequencies up to at least 1GHz.
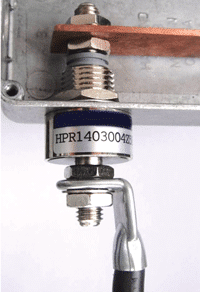
Figure 1. Typical feedthrough installation example.
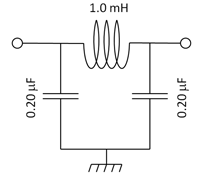
Lower frequency performance may require series inductors with the shunt capacitor. For example, these components could be arranged according to Butterworth criteria to reduce the cut-off frequency and maximize slope of the insertion loss curve. For example, the ever popular ∏ filter with a 16 kHz -3dB cutoff frequency, and 60dB per decade roll-off would consist of the components shown in Figure 2.
Figure 2. 16kHz Pi Filter.
While the value of an inductor has a constant relationship of µH = 5 x µF for an optimized ∏ filter; in many cases the inductor is a lower value than optimum during actual use due to weight, size, or cost constraints. The inductor can be susceptible to saturation at high current, thereby reducing the inductance value further. The other benefits of a series inductance is to increase the high frequency performance above the level achievable from a capacitor alone. The feedthrough capacitor is substantially immune from any effects of through current, and usually only has minor and predictable changes with applied voltage. For the lowest cost and size, and to eliminate through current performance variations, the feedthrough capacitor alone is the preferred, or initial, solution for high current and high frequency filtering requirements.
There have been several articles written regarding improved methods for measuring the low frequency performance of filters. A useful recommendation, particularly at frequencies below 100kHz, is to use current injection according to IEEE 1560 Method 10.5 at full current. Since high performance feedthroughs are functional well over 100MHz, measuring the component accurately is an important part of qualification. This article will address some of the concerns regarding measuring high frequency insertion loss of filters, particularly well above 30 MHz, while also accounting for high current levels.
An industry standard insertion loss measurement set-up is shown in Figure 3. This circuit has been successfully used in the bands from about 300kHz to over 30MHz. The challenge with this test set-up is the use at currents exceeding 30 amperes or greater, and at greater than 100MHz. Even though the test circuit is on a ground plane, the high frequency coupling across the power taps can have significant effects on the results. This high frequency coupling is shown in Figure 4.
Figure 3. Insertion loss test set-up according to MIL-STD-220B with load current and buffer networks.
Figure 4. Coupling across a DUT, when measuring insertion loss.
The “open” DUT (Device Under Test) zone can cause measurement limitations at high frequencies. This is particularly true for high current filters, as the geometry of the end electrodes and attaching wiring can extend for 2.0″ (50mm) or more on either side. As frequencies usually exceed 30MHz the parasitic capacitance across the filter (from one side of the capacitor to the other) can cause significant coupling around the filter. Consider that the feedthrough capacitor effectively shunts the center of the through conductor to ground, resulting in what are essentially opposing linear Beverage antennas.
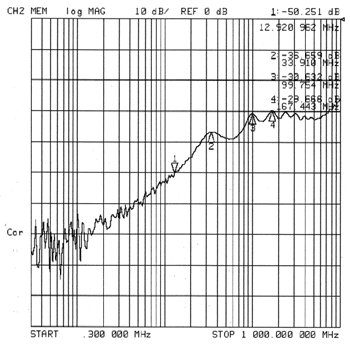
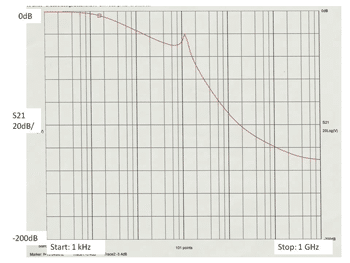
The coupling around a filter can be modeled as either capacitance or antenna coupling. The parasitic capacitance shown in Figure 4 couples higher frequencies around the filter shown in the center of the figure. The parasitic capacitance is proportional to several factors, including exposed areas, and inversely related to separation of the two sides of the filter. Antenna-type coupling around the filter is related to several factors including, principally, separation and exposed length. The free path loss is inversely proportional to the square of the separation and frequency, which is the coupled signal reduction with distance. The antenna efficiency of the radiating surface is complex and improves to a maximum at λ/4 and harmonics thereof. This factor, and several others, can combine to produce a maximum value of coupling at an array of frequencies. In order to get an estimate of this coupling effect, the connection wires to a DUT shown in Figure 5 were measured for isolation. This figure shows two test leads, both coaxially aligned with shields and ends shorted to an aluminum ground plane. The exposed lengths are about 50mm (2.0″) long, and the distance above the ground plane is about 13mm (1/2)”. If we measure the isolation between these wires, we get a rough estimate of the lead-in and lead-out coupling around a feedthrough capacitor. Figure 6 shows the isolation for the grounded wires shown in Figure 5. Frequencies below 1 MHz have over 70 dB of isolation. Above 1 MHz a noticeable reduction in isolation occurs, with 50 dB indicated at 13 MHz. The isolation tends to reduce to about 30 dB at 100 MHz . The isolation maintains a value of about 30 dB up to 1Ghz, where a further drop in isolation occurs. This effectively means that “open leads” to the DUT could produce a noise floor at about 30 dB at high frequencies. MIL-STD-220B is effective at measuring the lower frequency performance including the effects of voltage and current, but measurements at frequencies above 10MHz can be compromised by the “noise floor” due to this interlead coupling.
Figure 5. Grounded DUT hook-up test leads.
Figure 6. Isolation between grounded DUT hook-up leads.
NexTek has developed a line of compact high current feedthrough filter capacitors. Since the insertion loss of a C-type feedthrough is substantially unaffected by through current levels, it is advantageous to accurately evaluate the performance of a high current filter using less-than- full-scale test techniques. NexTek has also developed a method of accurately measuring the insertion loss at the component level with no load current being required and very accurate high frequency results.
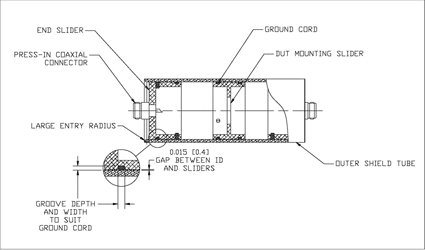
The high frequency performance of capacitors requires a fully shielded enclosure for testing, including shielding of one side of the filter from the other. A fixture such as this is shown in Figure 7, and can be found at www.nexteklight
ning.com/FilterTestFixture.html).
Figure 7. Feedthrough capacitor shielded test fixture.
The TEM cell inspired test fixture has an outer shield tube that is fashioned from a convenient diameter of metal pipe or tubing to fit around the largest expected filter. The inside will generally have to be precision turned and polished, and the inside entry edges should be well rounded. There are three internal sliders, which are piston shaped objects. Good results have been obtained with sliders and tubes made from nickel plated aluminum. The end sliders have coaxial connectors for connection to a network analyzer or source and detector. The coaxial connectors might have small springs, pogo pins or discs soldered onto the inner side of the center pins to make contact to the Device Under Test (DUT). The DUT slider should keep the capacitor centered by having a tapered face on one side, and/or a through hole which just fits the component. All three sliders have outer circumferential grooves, to hold ground cord in position, with holes through to the ID of the pistons, for securing the ends of the ground cord ends. With the adequate groove depth and width, and a small gap between the sliders and inside diameter of the shield tube, at least two complete circumferential shield grounds can be established between the sliders and the shield tube. Successful results have been obtained with both spiral and knit mesh type ground cord; however, silicone foam core with double layer SnCuFe mesh seems to work best. The ground cord effectively isolates left side from the right side of the middle slider, and the internal region of the test fixture from the external environment. The feedthrough capacitor is mounted on the middle slider, which is inserted near the midpoint of the shielding tube. The end sliders are inserted and advanced until contact is made with the end electrodes of the filter, when measurements can be taken.
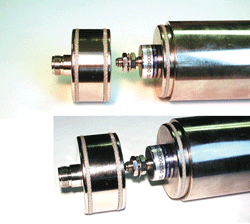
Figure 8. An HPR Filter being installed in test fixture.
TIPS ON MEASURING FILTERING PERFORMANCE
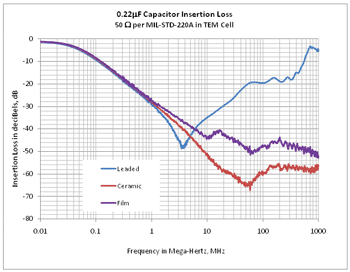
A. The performance of different filtering technologies can be assessed. For example, a leaded capacitor can be compared to a ceramic or metalized plastic feedthrough. Figure 9 shows that the leaded component has a resonance at about 3.3MHz. This equates to an ESL of about 10nH. The metalized film capacitor has an insertion loss dip at about 20 MHz. This dip can be more pronounced for higher capacitance values.
Figure 9. Comparison of various filter capacitors.
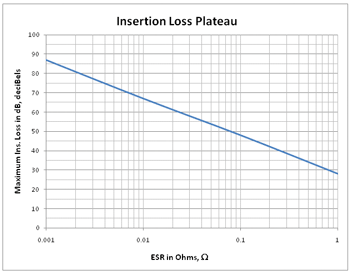
B. Estimating capacitor parasitic properties. Feedthrough capacitors approach an insertion loss plateau at high frequencies. The Equivalent Series Resistance (ESR) of a capacitor limits the continued improvement of shunting performance of a real capacitor at ever higher frequencies. The level of the plateau relates strongly to the ESR of the capacitor, through the curve shown in Figure 10. The metalized film capacitor has an ESR of about .075 Ohms. The ceramic feedthrough capacitor has an ESR of about 0.03 Ohms. This value of ESR can be used to assess dissipation or other parameters at high frequency.
Figure 10. Maximum insertion loss versus ESR
C. Coordination of filtering with shielding. The same coupling effects across the filter that compromise filter performance measurement can also affect the measured application level isolation of an enclosure. A general rule of thumb is that coupling between axially aligned wires is about -30dB. Note that the level of coupling is frequency dependent, and -30dB begins to be a good estimate at wire lengths greater than λ/20. Therefore, the shielding effectiveness of the enclosure could be somewhat less than the values of the filter insertion loss and still preserve isolation. If the shielding is 30 dB less than the filter insertion loss, the resulting two equal value paths might have a reduction of isolation of about 3dB.
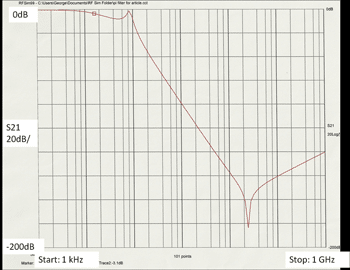
D. Modeling of filters with series inductors. Some applications require filter performance to be increased by use of series inductors. Accurately modeling the feedthrough capacitors and series inductors can yield predictable and accurate results. There are two commonly used inductors at high current; the wound type and the ferrite through-hole type. Wound type inductors generally have higher inductance and thus better low frequency performance; at the expense of size, weight and cost, and the electrical characteristics of self resonance. A simple but useful circuit analysis model of a wound inductor is a parallel inductor and capacitor. When the self resonance frequency is measured, the value of the capacitor can be estimated. In addition, the reduced inductance at full load current should be used, instead of the nominal. The parameters of the capacitor and inductor can be modeled quite accurately. Figure 11 shows the model of a 220nF/40uH/220nF filter. The characteristics of the capacitors are ceramic as shown in Figure 9; and the wound inductor self resonant frequency of 23 MHz corresponds to a shunt capacitance of 1.2pF, and the inductance drops to 30uH at peak current.
Figure 11. 22µF/40µH/.22µF Filter Insertion Loss.
Ferrite bead inductors are compact, low cost, easier to install on high current conductors, and tend to be dissipaters of RF power. The dissipation can turn significant portions of the unwanted RF energy into heat, instead of reflecting or circulating the energy within the system. However, these benefits are at the expense of substantial inductance reduction at full current, due to saturation, and generally less inductance to start with. The saturation effects can be minimized by gapping techniques, but this makes a more stable but further reduced inductance. If the inductor is a ferrite bead type, then the circuit analysis model would be an inductor in parallel with a resistor. Figure 12 shows the modeled performance of a filter with the same capacitors as in the previous example, and a ferrite bead 28A5131-0A2. This ferrite bead measures 160 nH with a 0.4mm (.016″) gap at full load.
Figure 12. .22µF/160nH/.22µF filter insertion.
Not only does the accurate measurements of insertion loss allow better high frequency modeling, but lower frequency modeling is virtually error free, provided that full current inductance parameters are used.
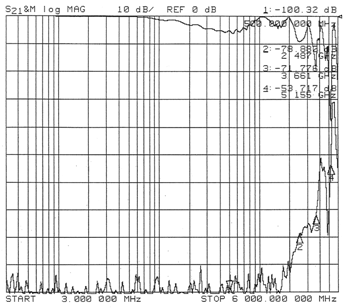
E. It is always good to perform a through and isolated test for the test fixture. An example of these test results for a test fixture with an inside diameter of 51mm (2.0″) and two 75mm (3.0″) long chambers on either side of the middle DUT slider is shown in Figure 13.
Figure 13. Example of calibration results for test chamber.
Note that this curve covers from 3MHz to 6GHz. The top curve represents the insertion loss of a wire connection through a hole in the middle DUT slider. Since the impedance of a through wire is far higher than 50Ω, a departure from a very low insertion loss is expected at about 500 MHz, and harmonics thereof. The measured insertion loss may be overstated somewhat at about 500MHz. The first problematic resonance seems to occur at about 3.7GHz. The lower curve is isolation, with a solid middle slider. This insertion loss responds to the resonance of the chambers, the shielding of the sliders and attaching cables (and analyzer), and the length of the internal connection leads. The isolation with short leads, of approximately 25mm (1″) in length, shows high levels of isolation to almost 2GHz, with reasonable isolation at 3.5 GHz. The first problematic isolation level is at about 4 GHz. This shows that the test fixture of this geometry is capable of accurately measuring insertion loss to more than 2GHz.
CONCLUSION
Accurate feedthrough insertion loss measurements, particularly at high frequency, are vital to understand component parameters, measure filtering performance, and/or design a filter. The shielded chamber presented has been used to over 1GHz, and is easy to fabricate and use.
REFERENCES
[1] The Engineering Handbook, Richard C. Dorf, CRC Press, 2005 Section 113.5 provides a good overview of the low frequency short comings of MIL-STD-220-B, and explains IEEE P1560, Method 10.5
[2] Phipps, Keebler, and Connatser, “Improving the Way We Measure Insertion Loss” Item Publications Nov., 2008. Print.
George M. Kauffman, PE, holds a BSME and MS in Engineering Management from the University of Massachusetts at Amherst. He leads NexTeks design and engineering team. Kauffman has extensive EMC and microwave design experience. He holds several patents in RF protection and related technology. He can be reached at engineering@nexteklightning.com.
Figure 8 shows an HPR 140 Ampere filter, which is secured to the DUT mounting slider, being slid into the outer shield tube. One ground mesh ring has passed into the outer shield tube, while a second mesh is close to entering. The end slider is shown with spiral ground cord, and would be installed after the DUT slider is inserted to approximately the midpoint of the outer shield tube. The N connector on each end would be connected into a through-calibrated network analyzer to measure the insertion loss of the filter with very high accuracy.

