I. INTRODUCTION
The advances in radio systems in the past and their ongoing progress has been joined by advances in measurement systems and, hence, they require further development of measurement and specification standards. Electric and electronic systems have to be designed and realized such that the escape of unwanted electromagnetic energy into the environment is minimized. Electromagnetic compatibility denotes a situation where electrical and electronic systems are not mutually interfering by electric, magnetic or electromagnetic interference [1], [2]. The high bandwidth and the low power levels used in modern communication systems make them highly sensitive to electronic disturbances.
The conducted and radiated electromagnetic interference (EMI) of electric and electronic equipment has to be measured to certify that the equipment fulfills international standards of electromagnetic compatibility, e.g. defined by [3]. For the measurement of the EMI spectrum over a broad frequency band with high spectral resolution spectral analyzers or EMI receivers are used that have to fulfill certain requirements, e.g. defined in [4]. We developed a time-domain electromagnetic interference measurement system that uses ultra high-speed analog-to-digital converters and real-time digital signal processing systems to enable ultra fast tests and measurements for electromagnetic compliance that fulfill the demand for measurements of today’s complex electronic equipment and systems [5], [6], [7], [8], [9]. Today, time domain electromagnetic interference measurement systems that use ultra high-speed analog-to-digital converters and real-time digital signal processing systems enable ultra fast tests and measurements for electromagnetic compliance for frequencies up to 26 GHz [7], [10]. Compared with traditional measurement receivers, the novel time-domain measurement systems reduce scan times by several orders of magnitude.
With such systems more complex measurements become feasible, like the complete angular characterization of a device under test (DUT) or the broadband search for low-level narrowband emissions. This allows to define new limits and new evaluation methods to validate equipment.
An interesting way to characterize stochastic EMI signals is to use the amplitude probability distribution (APD) [11]. The APD is defined as the part of time the measured envelope of an interfering signal exceeds a certain level [12]. The APD is closely related to the bit error rate of digital systems and, therefore, a definition of the emission limits on the basis of the APD would be appropriate for digital equipment. Furthermore, using the APD, information such as the rms voltage or average power can be obtained [13]. The possibilities in describing the amplitude statistics by the APD function encourage the definition of a new type of limit-lines that depends on the statistical behavior. The APD has been used for the analysis of fluctuating signals [14] and multi-carrier systems like orthogonal frequency division multiplexing (OFDM) radars and communication systems [11]. However, a major drawback for evaluating the APD so far has been the time required to evaluate the emissions at a specific frequency channel. In the presented time-domain system, the APD is evaluated and processed on several hundred channels simultaneously. This improvement and aforementioned advantages provided by using the APD function, encourage its incorporation in electromagnetic interference (EMI) measurement standards.
In this article we will describe the general concept of the APD function based analysis. Subsequently, we will introduce the real-time time-domain system that was used to implement APD function based analysis [10]. Then the new developed multi-channel APD will be described. Finally, a measurement using aviation emission detectors is performed and compared to CISPR detectors.
II. THE AMPLITUDE PROBABILITY DISTRIBUTION
The amplitude probability distribution provides for a description of the signal amplitude statistics. For a random variable , a value (t) is allocated to each element t. In the case of emission measurements, the random variable (t) represents the amplitude of a measured emitted signal at a specific time t, and a specific frequency f. The frequency f depends on the intermediate frequency (IF) used, while the time t is the dwell time of the performed measurement. The APD of a certain value v is given by
APD(v) = P((t) > v), (1)
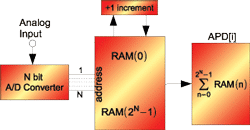
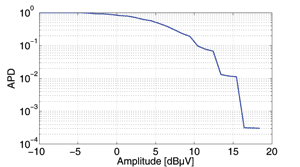
where P is the probability of (t) being above this threshold v. Eq. (1) can be represented by the block diagram shown in Fig. 1, described in CISPR 16-1-1 [4]. The measurement system’s input signal is sampled by an N-bit analog-to-digital converter (ADC), which provides for 2N distinct output levels. The following block is a RAM memory block which counts the number of occurrences of each amplitude level. Finally, the right-most block of Fig. 1 generates the APD function graph of each level according to (1). The measurement results of the APD of a single channel is plotted in Fig. 2. The minimum measurable probability of the APD, which is shown to be 10-4 in the graph, depends on the number of samples measured which is proportional to the measurement time.

III. REAL-TIME TIME-DOMAIN MEASUREMENT SYSTEM
Nowadays, various signal processing algorithms, such as for example the fast Fourier transform (FFT) algorithm, can be realized on configurable integrated circuits (IC) like field programmable gate arrays (FPGAs) or complex programmable logic devices (CPLDs). This yields compact and affordable systems. Furthermore, this opened the possibility to realize real-time time-domain EMI measurement systems [15]. These novel time-domain EMI systems could realize additional measurement features that surpassed the systems available on the market till then.
The real-time time-domain EMI measurement system uses ultra-high speed analog-to-digital converters (ADCs) to sample the emission signals. A wide band antenna in addition to a low pass filter precedes the ADCs, as shown in Fig. 3. Hence, we can detect the required bandwidth while avoiding aliasing effects due to high frequencies. The ADCs are arranged in a multi-resolution architecture to increase the dynamic range of the receiver [15]. The baseband of the receiver is 1.1 GHz, where frequencies above this limit are down-converted to the baseband by means of a down-converting front-end [16].
The sampled data is then accumulated in memory till the number of samples is sufficient for the required frequency resolution. Thereupon the samples in time-domain are transformed and stored into frequency bins using the short time fast Fourier transform (STFFT). The fast Fourier transform can benefit from repetition and symmetry properties for the discrete Fourier transform (DFT), and can be implemented into configurable integrated circuits. The frequency bins generated are applied afterwards to different detectors for being weighted, as illustrated in Fig. 3.
A. Multi-Stage Broadband Down-Converter
The sampling rate of current ADCs with high resolution is limited. Therefore, a multi-stage broadband downconverter was added to the system in order to increase the upper frequency limit to 18 GHz [9]. The current system enables measurements in the frequency range from 10 Hz to 26.5 GHz and adds the required IF-filters for the military and aviation EMC standards MIL-STD-461F [17] and DO-160F [18]. With integrated low-noise amplifiers (LNA) and a high 1 dB compression point (P1dB) of the radio-frequency (RF) front-end, the system achieves high sensitivity through an ultra-low system noise floor power spectral density of below -150 dBm/Hz and a high IF dynamic range exceeding 60 dB over the complete frequency range [10].
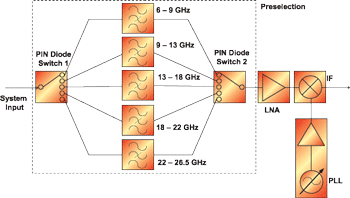
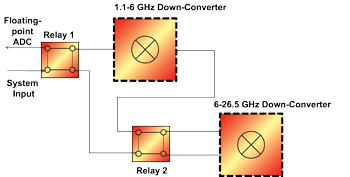
The basic block diagram of the multi-stage broadband down-converter is shown in Fig. 4. Input signals in the frequency range from 1.1-6 GHz are converted to the band below 1.1 GHz and sampled by the ADCs. The down-converter includes an LNA to ensure high sensitivity. A single fixed preselection bandpass filter suppresses the image frequency band and acts as a preselection filter, increasing the dynamic range for broadband, noise-like and narrowband out-of-band input signals. Input signals above 6 GHz are in a first step down-converted to the range below 6 GHz. The block diagram of the 6-26.5 GHz down-converter is given in Fig. 5. The preselection consists of 5 ultra-wide bandpass filters with bandwidths between 3 and 5 GHz. The bands are switched via low-loss single-pole-quintuple-throw (SP5T) PIN-diode switches. An integrated, broadband LNA amplifies the input signal and increases the system sensitivity. The amplified signal is then down-converted by a broadband mixer with low conversion loss and a low phase-noise local oscillator signal generated by a phase locked loop (PLL)-synthesizer.
In order to measure low-power emission signals in the higher GHz-range, a high system sensitivity is needed. To decrease the system noise figure, passive components with low insertion loss have to be used in the preselection, as the noise figure of a passive device is equal to its insertion loss. These components before the LNA are mainly defining the system noise figure F, according to [19]
![]() (2)
(2)
where Gi is the available power gain of stage i and Fi is the noise figure of stage i. The implemented PIN-diode switches exhibit a low insertion loss below 3.6 dB for all paths. The isolation exceeds 30 dB over the complete frequency range from 6-26.5 GHz.
B. Measurement
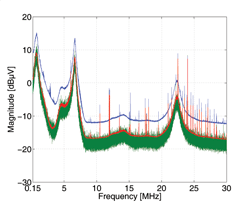
Fig. 6 illustrates a conducted emission measurement performed on a vacuum cleaner power cord. Quasi-peak and CISPR-RMS-AVG detectors are used to weight the measured emission extracted using a 9 kHz IF-filter as required by CISPR 16-1-1. In addition, a positive detector is used to weight the emission by a 1 kHz IF-filter, required by DO-160F.
The lower noise level measured using the positive detector in comparison to the quasi-peak detector is due to the smaller equivalent noise bandwidth of the 1 kHz IF-filter.
IV. THE PARALLEL CHANNELS APD SYSTEM
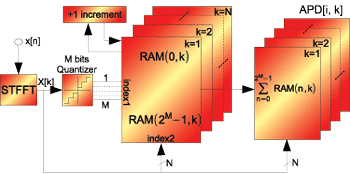
The schematic of the APD measuring function introduced in this paper is shown in Fig. 7. The frequency bins generated by the short time fast Fourier transform (STFFT) block are passed into a multichannel amplitude quantizer. The quantized amplitude resolution in the new EMI measurement system can vary between 0.25 dB and 3 dB. The output of the quantizer per channel k determines the address i of the counter in the corresponding memory block RAM (i, k) that is incremented. The process of quantizing and incrementing counters is executed until the defined dwell time Td elapses, whereupon the APD(k) is calculated using the equation
A. The Probability Function
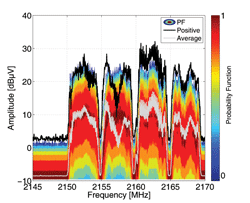
In addition to the APD plotting, the time-domain EMI measurement system can plot the probability function. A measurement of a Wi-Fi signal was performed between 2.14 GHz and 2.175 GHz using the APD measuring function. For the purpose of comparison, the same measurement was repeated using positive peak and average detectors. The results of both measurements are plotted in Fig. 8. The average curve overlaps the part of the APD curve with the highest probability, while the positive detector curve overlaps the highest measured values of the emitted signal. The measurement was performed with a dwell time of 1 s and an amplitude resolution of 0.25 dB. An 120 kHz IF-filter defined in CISPR 16-1-1 and a frequency step of 50 kHz were used. It can be seen that the APD curve is more powerful for evaluation than the single detectors in one graph. This could help in decreasing measurement time, while keeping all the valuable information of emissions which are being measured.
B. The New Limitline Definition
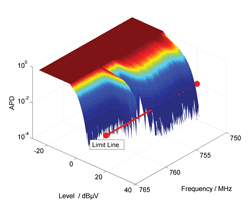
The implementation of the multichannel APD measuring function provided the means for introducing new evaluation methods for emission measurements. In Fig. 9, a three dimensional surface is plotted representing a multichannel APD measurement of a DVB-T channel (taken from [20]). Currently used limitlines are defined by their amplitude. In the 3-D graph of Fig. 9, they will be represented by a plane. The new limitlines proposed are defined by their amplitude and probability. This will be beneficial for non-stationary signals. The new limitlines will be projected as a straight line into the APD 3-D spectrum. As an example, the limitline shown in Fig. 9 has an amplitude of 20 dBµV and a cumulative probability of 10-2. The DUT fails at the frequencies where the spectrum covers the limitline. This is the case for frequencies below 758 MHz according to Fig. 9.
V. CONCLUSION
A real-time time-domain EMI measurement system from 10 Hz up to 26.5 GHz was presented. This system satisfies the requirements for valid emission measurement according to CISPR 16-1-1, MIL-STD-461F and DO-160F standards. The EMI measurement system is equipped with a multichannel APD measuring function. It has been shown that the multichannel APD measuring function based analysis can be implemented on current technology and that it can give more depth of information about the measured emissions. This system allows the definition of new limitline concepts which can be used e.g. to evaluate the fluctuation of signals.
ACKNOWLEDGMENT
The authors would like to thank the Bayerische Forschungsstiftung for funding this project.
REFERENCES
[1] C. R. Paul, Introduction to Electromagnetic Compatibility. New York: John Wiley & Sons, 1992.
[2] C. Christopoulos, Principles and Techniques of Electromagnetic Compatibility, ser. ISBN 0-8493–7892–3. CRC Press, 1995.
[3] “Comité International Spécial des Perturbations Radioélectriques,” Feb. 2011. [Online]. Available: http://en.wikipedia.org/wiki/Comité_International_Spécial_des_Perturbations_Radioélectriques
[4] “Specification for radio disturbance and immunity measuring apparatus and methods part 1-1: radio disturbance and immunity measuring apparatus – measuring apparatus,” CISPR16-1-1-am1 3rd ed., 2010.
[5] F. Krug and P. Russer, “The time-domain electromagnetic interference measurement system,” IEEE Transactions on Electromagnetic Compatibility, vol. 45, pp. 330–338, 2003.
[6] F. Krug, D. Müller, and P. Russer, “Signal processing strategies with the TDEMI measurement system,” IEEE Transactions on Instrumentation and Measurement, vol. 53, no. 5, pp. 1402–1408, 2004.
[7] S. Braun and P. Russer, “A low-noise multiresolution high-dynamic ultra-broad-band time-domain EMI measurement system,” IEEE Transactions on Microwave Theory and Techniques, vol. 53, no. 11, pp. 3354–3363, 2005.
[8] S. Braun, T. Donauer, and P. Russer, “A real-time time-domain EMI measurement system for full-compliance measurements according to CISPR 16-1-1,” IEEE Transactions on Electromagnetic Compatibility, vol. 50, no. 2, pp. 259–267, 2008.
[9] C. Hoffmann and P. Russer, “A real-time low-noise ultra-broadband time-domain EMI measurement system up to 18 GHz,” IEEE Transactions on Electromagnetic Compatibility, vol. 53, 2011.
[10] C. Hoffmann, A. Boege, and P. Russer, “A low-noise time-domain EMI measurement system for measurements up to 26 GHz,” Proceedings of the 30th URSI General Assembly 2011, Istanbul, Turkey, 13–20 August, 2011.
[11] K. Wiklundh, “Relation between the amplitude probability distribution of an interfering signal and its impact on digital radio receivers,” IEEE Transactions on Electromagnetic Compatibility, vol. 48, pp. 537–544, 2006.
[12] Y. Yamanaka and T. Shinozuka, “Measurement and estimation of BER degradation of PHS due to electromagnetic disturbances from microwave ovens,” Electronics and Communications in Japan (Part I: Communications), vol. 81, no. 2, pp. 55–63, 1998
[13] M. Kanda, “Time and amplitude statistics for electromagnetic noise in mines,” IEEE Transactions on Electromagnetic Compatibility, vol. 17, pp. 122–129, 1975.
[14] K. Gotoh, Y. Matsumoto, S. Ishigami, T. Shinozuka, and M. Uchino, “Development and evaluation of a prototype multichannel APD measuring receiver,” Proceedings of the 2007 IEEE International Symposium on Electromagnetic Compatibility, pp. 1–36, 2007.
[15] S. Braun, M. Al-Qedra, and P. Russer, “A novel realtime time-domain EMI measurement system based on field programmable gate arrays,” in Proceedings of the 17th International Zurich Symposium on Electromagnetic Compatibility, 2006, EMC Zurich 2006, Singapore, Feb. 2006, pp. 501–504.
[16] C. Hoffmann and P. Russer, “A time-domain system for CISPR 16-1-1 compliant measurements above 1 GHz,” in Proceedings of the Asia-Pacific Symposium on Electromagnetic Compatibility, Jeju Island, Korea May, 16–19, 2011. APEMC 2011, 2011, pp. 1–4.
[17] “Requirements for the control of electromagnetic interference characteristics of subsystems and equipment,” MIL-STD-461F, 2010.
[18] “Environmental conditions and test procedure for airborne equipment,” DO-160F, 2007.
[19] W. B. Davenport and W. L. Root, An Introduction to the Theory of Random Signals and Noise. Wiley-IEEE Press, Oct. 1987.
[20] H. H. Slim, C. Hoffmann, S. Braun, and P. Russer, “A novel multichannel amplitude probability distribution for a time-domain EMI measurement system according to CISPR 16-1-1,” EMC Europe 2011, York, UK, 2011.
Hassan H. Slim received the Bachelor of Engineering (B.E.) degree in Computer and Communication Engineering in 2005 from Business and Computer University College (BCU) in Beirut, Lebanon. He obtained his Masters of Science (M.Sc.) degree in Microwave Engineering in 2007 from the Technische Universität München (TUM), Germany. Since 2008 he is working towards his Dr.-Ing. degree at the Institute for High-Frequency Engineering at TUM, Germany under the supervision of Prof. Dr. Peter Russer. His current research is focused on investigations of electromagnetic compatibility (EMC) techniques above 1 GHz, in addition to signal processing techniques and automation routines applied in EMC. Since June 2011 he is working with GAUSS INSTRUMENTS GmbH as a software design engineer. He is a member of IEEE. He can be reached at hslim@tdemi.com.
Christian Hoffmann received the Dipl.-Ing. degree in Electrical Engineering from the Technische Universität München (TUM), Munich, Germany, in 2008. From 2008 to 2011 he was working at the Institute for High-Frequency Engineering at TUM, Germany as a research assistant. He is currently employed as an RF Design Engineer at GAUSS INSTRUMENTS GmbH, Munich, Germany, where he is working towards the Dr.-Ing. degree. His research interests include measurement techniques in the microwave and millimeter wave regime, microwave and millimeter wave passive and active circuits and digital signal processing. His research is focused on the investigation of electromagnetic compatibility in time-domain above 1 GHz. Christian Hoffmann is a member of the IEEE and VDE. He can be reached at choffmann@tdemi.com.
Stephan Braun studied Electrical Engineering at Munich University of Technology (TUM), and received his Dipl.-Ing. degree in 2003. From 2003-2009 he was research assistant at the Institute for High-Frequency Engineering, where he received his Dr.-Ing. degree in 2007. Dr. Braun is now managing director of GAUSS INSTRUMENTS. His research interests are EMC and microwave measurement technology, as well as RF-circuits and digital signal processing. Further interests are fast digital circuits and configurable digital logic. Dr. Braun is Member of the VDE and IEEE. He can be reached at braun@tdemi.com.
Arnd Frech studied electrical engineering at the Technische Universität München (TUM), Munich, Germany with focus on high-frequency engineering and electronic systems. He received the Bachelor of Science and the Dipl.-Ing. degree both from the Technische Universität München in 2005 and 2006, respectively. After finishing his diploma thesis in the field of near-infrared spectroscopy at the Swiss Federal Institute of Technology, Zurich, Switzerland, he joined the Institute for High-Frequency Engineering at the Technische Universität München as a research assistant working towards the Dr.-Ing. degree. He is co-founder and managing director of GAUSS INSTRUMENTS GmbH, working in the field of EMC and RF measurement instrumentation and high-speed digital signal processing. He can be reached at frech@tdemi.com.
Johannes A. Russer received his Dipl.-Ing. (M.S.E.E.) degree in electrical engineering and information technology from the Universität Karlsruhe, Germany, in 2003. In 2004 he joined the University of Illinois at Urbana- Champaign as a research assistant where he received his Ph.D.E.E. degree in 2010. From 2007 to 2010 he has been working for Qualcomm Inc. as an intern. Since 2010 he is a Postdoctoral Research Fellow at the Institute of Nanoelectronics of the Technische Universität München (TUM), Germany. The current research interests of Johannes A. Russer include the modeling of multiphysics problems, numerical electromagnetics and stochastic electromagnetic fields. He is a member of IEEE, VDE and of the Eta Kappa Nu honor society. He can be reached at jrusser@tum.de.
