Reasons for widely differing results in commercial radiated emission measurements.
MIL-STD-461 RADIATED EMISSION MEASUREMENTS
In 1967, the first version of MIL-STD-461 was introduced. Radiated emission measurements were allowed outside of a shielded room but due to the low levels of radiated emission limits, compared to an average ambient, measurements were invariably made inside a shielded room. Most of these rooms did not contain radiofrequency absorber and errors as high as +40dB to –30dB were observed.[1] Even so, military and space authorities were concerned with emissions 3dB above the limit (possibly 43dB above or 27dB below). In MIL-STD-461D, a requirement was introduced for a minimum amount of absorber around the EUT and on the back wall. While this certainly helped reduce errors, it was not perfect. Many test houses have now implemented a semi-anechoic chamber with ferrite tiles for low frequency and absorber cones for high frequency. In the small room described in [1], ferrite tiles and cones as well as absorber loads are placed at strategic locations in the room.
Comparing the radiation from a reference source on the Open Area Test Site (OATS) to the well damped room, the correlation from 20MHz to 1000MHz at room resonance frequencies is +5 and –9dB and a maximum of +5dB at all other frequencies. The field uniformity measurement for this room is also excellent.
COMMERCIAL RADIATED EMISSION MEASUREMENTS
These measurements are made on an OATS, 3m or 10m semi-anechoic chamber, or in a GTEM cell, or in some cases with the EUT in situ at a manufacturer’s site. In an article published in 2000, the results of radiated emission testing from five different test facilities were compared.[2] The test facilities included two 3m and one 10m OATS, one GTEM and two semi-anechoic chambers, one of which was a 3m. One difference between the measurements on all the sites was that the EUT was the same equipment but had different serial numbers. When emissions were measured at the same frequency at all the test facilities, a difference of 12.46dB between the first 3m OATS and the 10m anechoic chamber was seen and a difference of 14dB was seen between the first 3m OATS and the 10m OATS. In all cases, the first 3m OATS recorded lower emissions. At some frequencies, emissions were seen at one site and not at another and ambients were ruled out. This represented an error of up to 25dB. The 3m OATS measurements were then suspect.

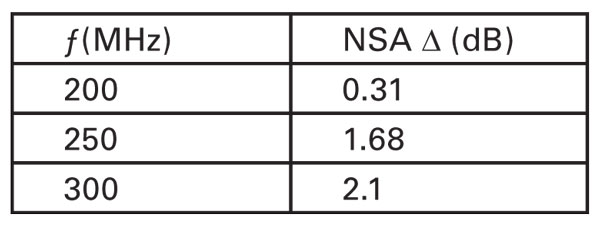
The NSA calibration was repeated for the first 3m OATS at the critical frequencies using “Roberts” dipole antennas and the results are shown in Table 1.
The calibration of the test equipment, cables and antennas used on the first 3m OATS was repeated and all were within specification.
The cable orientation used at the first 3m OATS test facility was in accordance with Figure 9(c) of ANSI C63.4, with the power/signal cable brought back up to the non-conductive tabletop and then looped back down in a serpentine fashion with the droops at least 40cm above the ground plane. Some further manipulations were then made to maximize emissions. ANSI C63.4 mentions that “in order to replicate emission measurements, it is important to carefully arrange not only the system components but also system cables. Wires and AC power cords.” Cable orientation at all other sites were unknown but its importance was seen in tests on the final site.

The same EUT was then sent to the second 3m OATS and the results were compared to the first 3m OATS with a 7.2dB difference. Cable orientation was compared between the two sites and in the second 3m OATS, the cables were draped down from the center of the turntable rather than from the edge. Then it was brought back from the power supply and coiled in the center of the turntable in a large loop. The same EUT was then re-measured on the first 3m OATS using the identical cable orientation and the difference between the two sites is shown in Table 2. This level of correlation we consider acceptable. Also, the 2nd 3m OATS measurements and the repeat NSA calibration seem to vindicate the 1st 3m OATS facility. The measurements also reinforce the importance of cable orientation.
It was expected that the article in 2000 would have resulted in some comments or recommendations or even disagreement, but no response was elicited. Since 2000, we have seen numerous cases where radiated emission data from different test sites have shown an unacceptable variation. We have observed that the correlation between measurements made on two OATS is often higher than the correlation between an OATS and a 3m or 10m semi-anechoic chamber.
In one case, a consistent 26dB was seen between one site and another. Only after the site with the 26dB higher measurement was asked to use a signal generator to check the test instrument was the problem found. It was a modern instrument with a switchable 26dB pre-amplifier and inclusion of the amplifier was not indicated on the front panel. This situation had been in effect since the instrument was first purchased.
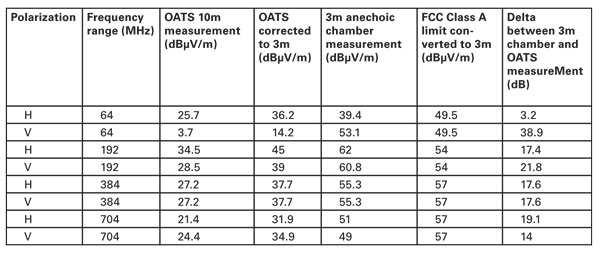
Very recently, we have been working with a manufacturer who has had equipment tested at two 10m OATS test sites with a good correlation. However, the measurements made in a 3m anechoic chamber by a test facility chosen by the customer results in some very different emission levels. Not only was there a 38.9dB variance between the first OATS and the 3m chamber, but in comparing the emissions many of the emissions were higher for vertically polarized fields on one site and on the other site for horizontally. Table 3 compares the emissions against the FCC Class A measured at 10m on the OATS and 3m in the chamber. FCC Class A measurements are routinely made at 10m on the first OATS and to convert these approximately to the 3m chamber measurements, 20 log 10m/3m = 10.5dB was added. This distance correction is strictly true only for a point source. In measurements on large equipment or equipment with cables, we find that the difference between measurements at 10m and 3m is not always 10.5dB. However, the error is nowhere near as large as the differences shown in Table 3.

Despite a close correlation between the two 10m OATS measurements, in which the EUT passed the Class A limits with a 9dB safety margin, the customer insisted that the measurements made by the facility with the 3m semi-anechoic chamber was correct. The manufacturer had already gone to great lengths in the design and manufacture to achieve the low levels shown in Table 3 and further improvement was needed in the design and engineering of the EUT to satisfy the customer. This resulted in more expense for the manufacturer, added to the frustration in knowing that the EUT had almost certainly passed the requirements and a delay due to numerous levels of re-engineering.
CONCLUSIONS
It is not clear why such a large variance in commercial radiated emissions exists. If a facilities site has met the Normalized Site Attenuation (NSA) calibration, then the OATS and anechoic chamber measurements should be comparable, which is often not the case. Does the anechoic chamber exhibit resonances that are not seen in the NSA calibration? Cable orientation and the time spent in maximizing cable emissions plays a role but surely not to the extent of 25 and 38.9dB as in the two examples. Also, at high frequency, where emissions may be sourced by seams in an enclosure, the emission may be in the form of a narrow beam and table rotation speed does affect the detection of such an emission. The correction of 10.5dB in going from a 10m to 3m measuring distance is also not always correct, especially for physically large EUTS. In the first OATS site described in this report, a sanity check is made of the measurement cable and antenna by using the known levels from FM transmitters in the vicinity. These have not changed significantly over the last 12 years and their use is the only known benefit of the OATS ambient levels.
We propose that some standard form of site validation prior to each test be performed. One suggestion is the mandatory use of an inexpensive battery-powered 30MHz–1000MHz comb generator connected to a fixed vertical and horizontal orientation and length section of conductor, representing the cable. The source needs to be stable with varying battery voltage and with a shutdown when the voltage falls too low. Expecting a standard EUT cable orientation from all test sites will go some way in correlating emissions between sites. Other options must exist and the purpose of this report is to stimulate discussion, compare anecdotes and find the source of errors and a solution to what we perceive as a major problem, especially for manufacturers, but also for the reputation of test facilities.
REFERENCES
[1] Weston, D.A. Electromagnetic Compatibility: Principles and Applications. Published by Marcel Dekker, 2000.
[2] Weston, D.A. “Lack of Standardized Testing Leads to Widely Varying Measurements at Different Commercial Test Sites,” NARTE News, Volume 8, Number 3, Fall 2000.
DAVID A. WESTON is principle EMC Engineer at EMC Consulting Inc., Merrickville, Ontario Canada. A member of IEEE and NARTE, Weston has worked full time in EMC for the last 30 years. He is author of the book “Electromagnetic Compatibility: Principles and Application,s” as well as numerous papers and reports, many of which are available at emcconsultinginc.com. He studied at Croydon Technical College from 1960 to 1965 and in 1965 received the Radio and Television certificate from the City and Guilds of London Institute, both in England.
