In the second part of this topic I will explain how to understand the output of a square magnetic near field probe. My good friend Doug C. Smith explained me this idea many years ago and it is really useful for EMI troubleshooting.

In my last post (June 2018), I reviewed the response of a magnetic near field probe. The conclusion was basically that the output voltage from the probe (what you see in the screen of your scope) is the derivative of current (not the current!) in the sensed conductor (wire or trace). At the end of my blog I wrote: “ … when using a ROUND magnetic near field probe, you will see in the screen of your instrument the time or frequency domain of the derivative of the current in your circuit.” I promised to explain the output from a SQUARE near field probe. Here is that explanation.
In the output of the square loop probe we have the same signal as in a round probe: the derivative of current BUT additionally, that output is a replica lower in amplitude of the voltage drop in the sensed wire/trace because the inductive effect in that conductor.
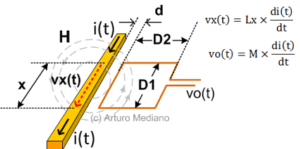
Consider for example in Fig. 1 a wire or trace with current i(t). The voltage drop vx(t) in length x of the wire because its inductance Lx is vx(t) = Lx di(t)/dt. Approaching a square loop to the first wire the output of the loop will be a voltage vo(t) = M di(t)/dt were M is the mutual inductance between both circuits (typically M/L ratio is 30%-50% for square loops and close to the circuit to be sensed).

Fig. 1. Simple analysis of the output from a square magnetic loop.
So, the output voltage of the probe is: i) the derivative of current i(t) and ii) a replica of the voltage drop in the sensed circuit vx(t), with smaller amplitude. I have prepared a simple experiment to explain the idea (Fig. 2).

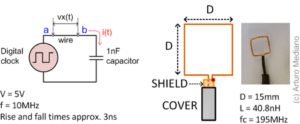
Fig. 2. Basic idea for our experiment.
A signal generator with a 10MHz 5V square waveform is connected to a capacitive load of 1nF. A square loop 15mm in side is built and located close to the circuit to measure the small length of wire between a and b (15mm). The loop has approximately 195MHz bandwidth with inductance of 40.8nH.
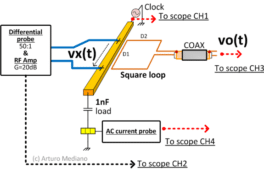
In Fig. 3 the detailed setup of the experiment is included. The clock is connected to the capacitor through the trace to be sensed and four signals are measured with a Keysight four channels scope.
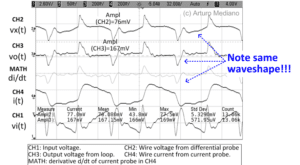
The voltage drop in the trace is measured with a differential voltage probe (CH2), the square loop is located close to the trace (CH3), the current through the trace is measured with an AC current probe (CH4), and finally the input voltage to the trace is measured with a passive x10 probe (CH1). See Fig. 4 with the screen of the measured signals.

Fig. 3. Experiment description.

Fig. 4. Experiment results.
Some important ideas about the results of the experiment:
- Input voltage 10MHz from signal generator (CH1) is not square wave. The original square wave signal is distorted because the effect of the big capacitive load (obvious).
- Current probe output i(t) is in channel CH4
- Using the MATH scope function, we can plot the derivative of that current probe output.
- Note how the output vo(t) waveform in CH3 of the magnetic loop is equal to the derivative of i(t) in CH4 (the MATH function) as explained in our previous blog: vo(t) = Mdi/dt
- The output voltage vo(peak) (CH3) is from measurements approximately 167mV. We can estimate considering M/L in the range of 30%-50% that the voltage drop in the trace (in the 15mm sensed length) is vx = 330mV to 550mV.
- Using a differential probe and linear amplifier, the voltage drop is measured as in CH2. Note this signal is equal to the output from the square loop in CH3. The measured peak for our probe (50:1) and amplifier (20dB) give us a measure of vx=380mV (in the range estimated previously).
As a conclusion, if you use a SQUARE loop for your measurements, you will be able to see a waveform replica (30-50% lower) of the voltage drop in the sensed wire. That waveform will be proportional to the derivative of current in that wire.


