I am so excited! My son Roger, a Sophomore in engineering, is learning how to make models in JMAG for his internship. He was talking about what great insight a mathematical model gives, and I said that it was possible to make a physical model (a scale model) instead. In the old days, it was quicker and gave different insight than a mathematical model imparts. An old physical model of a reverberation chamber was in the attic*. It was complete with a device under test (DUT) connected to a wiring harness with a monopole antenna. He was amazed! Once upon a time I used it to predict the antenna voltage that would result from a given DUT noise voltage, this helped shorten the motor development time. When I had the voltage waveform of the DUT, which was a DC permanent magnet motor, I knew the antenna voltage waveform up past the AM band. Knowing if a device is too noisy and needs extra suppression early in the development cycle helps shorten the time to get the device to market! I also used some FEA modeling for comparison. It makes for an interesting study.
The idea is this: a lot of problems in EMC can be boiled down to a box and a wire. This is well known. See for example, Ott pp. 464-465. A PC with a cable coming from it, a motor with power leads, a battery charger with the power cord to the wall and to the cell phone All have some device which makes noise, and they all have a way for the noise to get out of the “box” containing the device as shown in Figure 1. Sometimes we have to worry about how much radiated noise comes from the wires and the “box.” In this case it is often possible to simplify the problem to a box, a noise source, and a single wire as shown in Figure 2.
My particular problem was dealing with long wave and AM band noise from 150kHz to 2MHz. Typically, the test antenna is so close to the wiring and the device, that it picks up noise through capacitance instead of direct radiation. In my case the antenna test was done in a shielded room. I wanted to find out how much capacitance there was between the device and the antenna so I could figure out how much noise the antenna would pick up when I made changes to the RF suppression circuit used in the device.
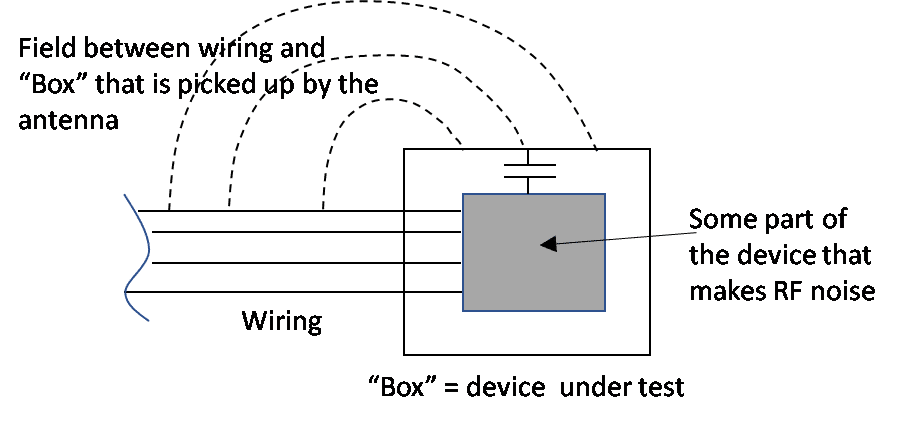
Figure 1. A Typical Source of RF Noise—a Device with Wires
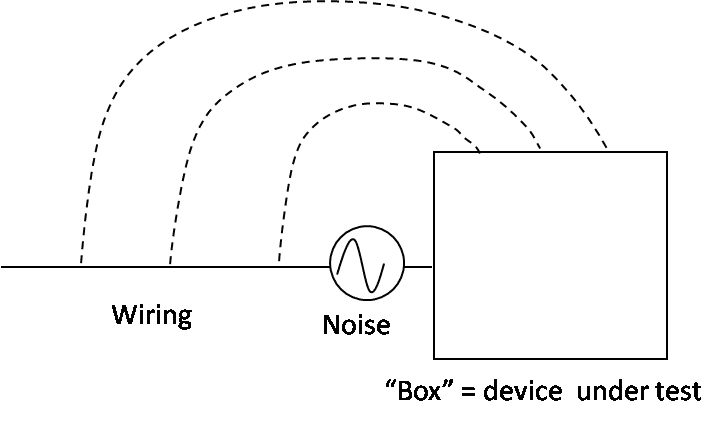
Figure 2. A Simplification of the Typical Source of Noise—One Wire, a Noise Source and a Box
Here is a picture of the scale model in Figure 3. The whole thing is only about a foot and a half on each side. The walls, floor and ceiling are made out of some foam board that comes with foil on both sides. It’s been a while, but I think the monopole mast was the inner conductor of a RG58 coaxial cable. The monopole ground plane was made by soldering the shield of the coaxial cable to a brass plate. Conducting aluminum tape, with a conductive adhesive layer containing silver oxide was used to hold the chamber together. Thus, the tape and foil allowed us to simulate the continuously conducting chamber walls. It is important that the conductivity is continuous because of the way a reverberation chamber (or anechoic chamber at low frequencies) functions. The chamber is a Faraday cage to shield the test from outside noise. Some noise may get into the chamber via sprinklers, ports, lights and cables in the chamber. (See Christmas Music in the Chamber.)
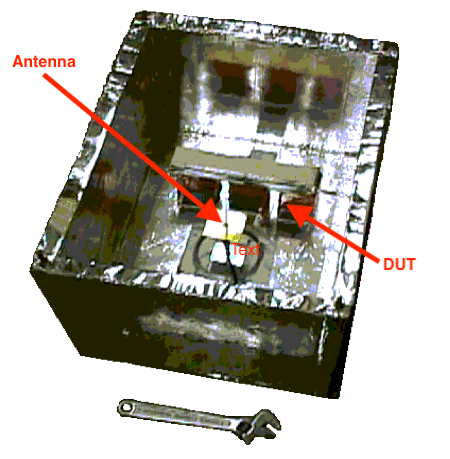
Figure 3. Physical Scale Model of Reverberation Chamber
The model is small enough so that the capacitance between the DUT and the antenna can be measured with an LCR meter. For the low frequencies in my test the dimensions of the chamber are quite small. When the wavelength is large compared to the dimensions of the room (as in this situation), the charge distribution on the wires and walls is about the same as it would be if DC voltage was used to produce the charge. This is a “quasi-static” condition.
Since the antenna is “connected” to the DUT by the natural capacitance between them, a simple circuit model could be used to calculate a transfer function between the voltage of the DUT wiring and the voltage of the antenna. The circuit model had to include all the capacitances between the wiring, the box, the antenna mast, and the antenna counterpoise (the plane at bottom of the antenna) as shown in my sketch of Figure 4. Using an LCR meter, the capacitances were easily measured in the scale model. This would be very difficult in the full-size version.
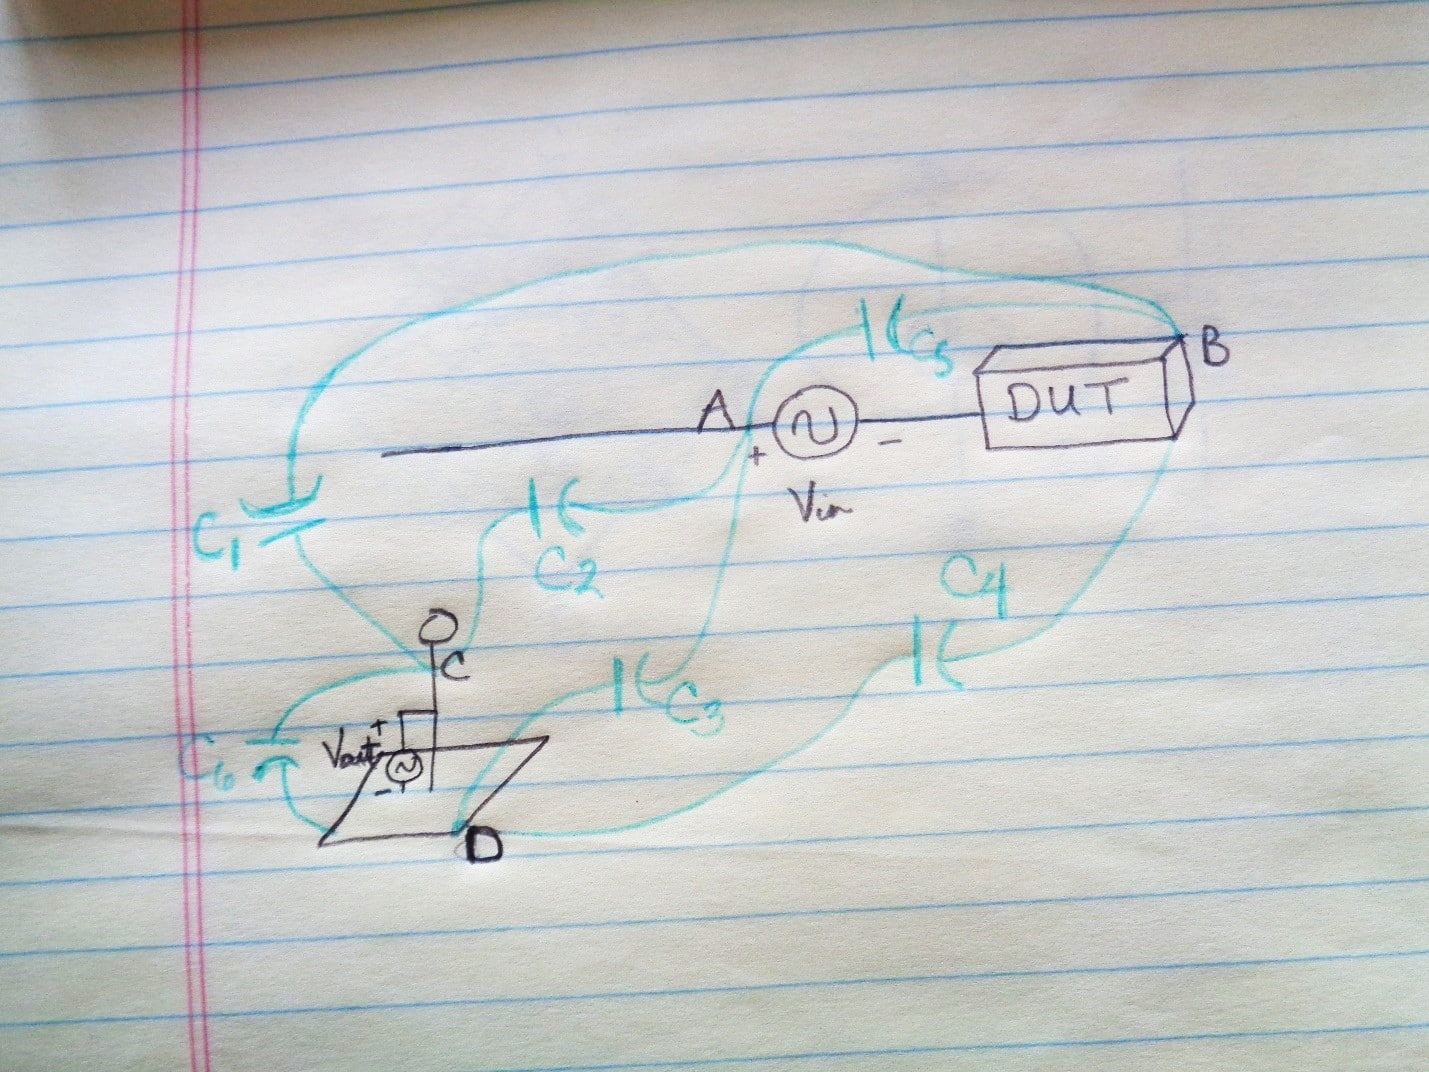
Figure 4. Capacitances to be Measured in Scale Model
The circuit was re-drawn in Figure 5. Now it is apparent that the capacitances form a type of bridge circuit. It is the differences between the capacitances which result in voltage on the antenna. So, the capacitance between the DUT wiring and the antenna must be different than the capacitance between the DUT “box” and the antenna for there to be noise detected by the antenna.
Adding the voltages and voltage drops around a loop sums to zero by Kirchoff’s voltage law, as always. In this way, a series of equations was identified. I told Roger the input voltage has an impedance that we might need to add to our equations, Z7, but we will try to ignore it.
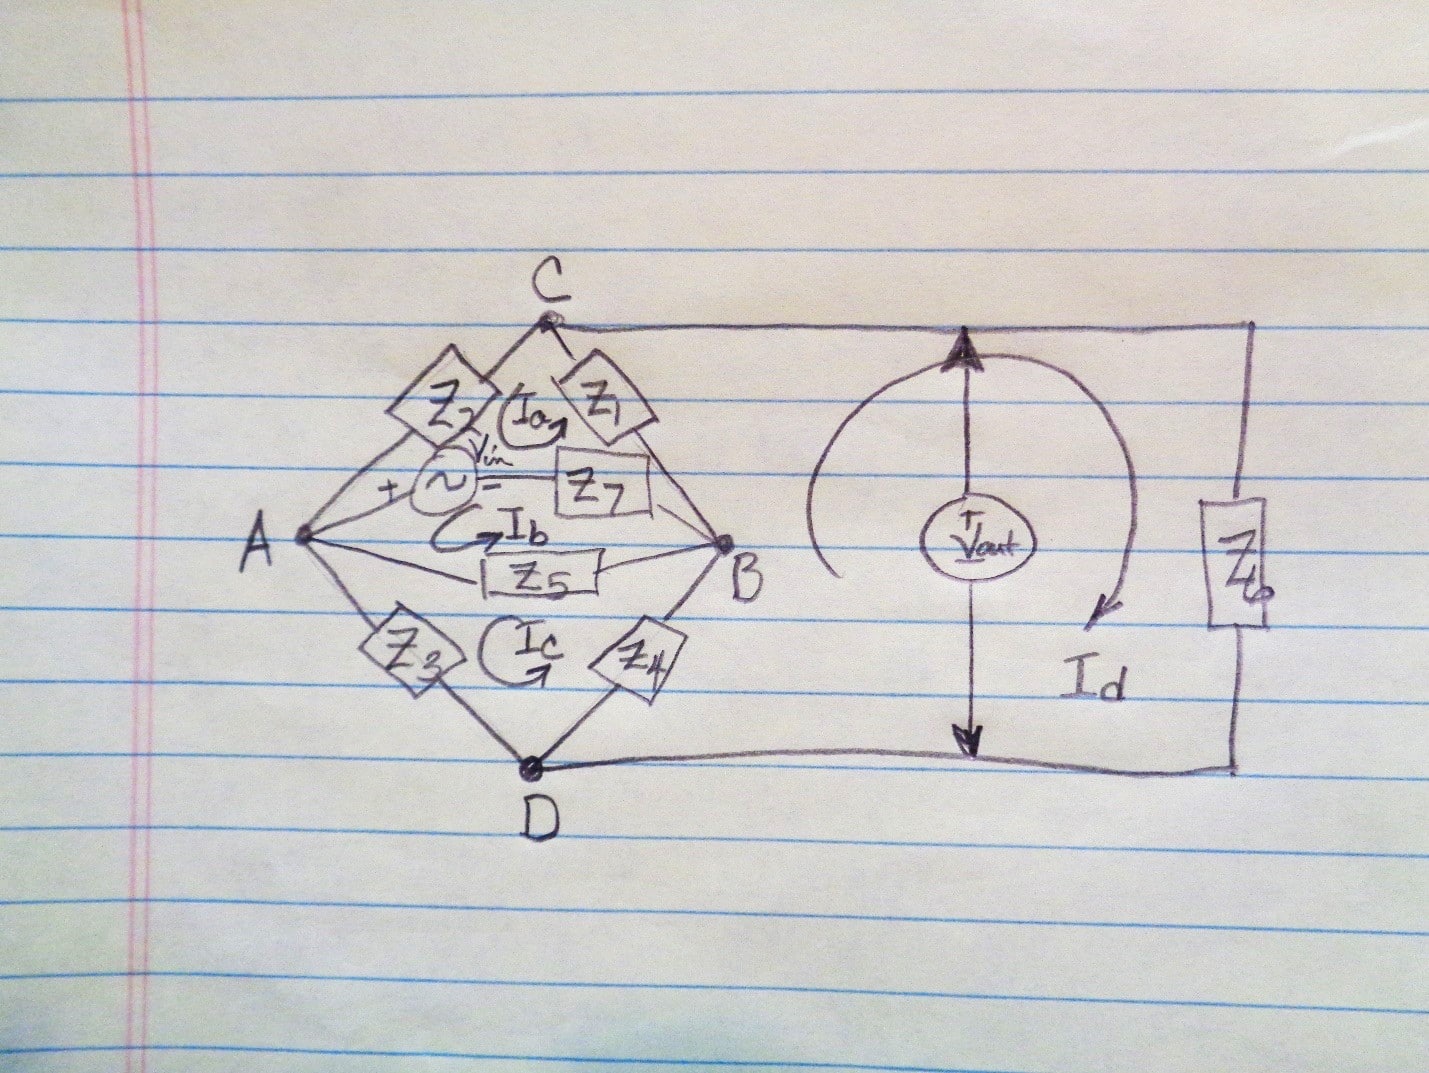
Figure 5. Redrawn Circuit Diagram for Capacitive Model
As you can see, it was easy to derive the loop equations seen in Figure 6 from the bridge of Figure 5 and get them into a form so that we could use matrix manipulation in Figure 7. There are some currents, Ia, Ib, Ic and Id that had to be introduced to make the equations. These are just temporary. Trying to simplify this is even more messy than forming the matrix. I used an old copy of Mathcad to obtain the transfer function by substituting capacitance values into the matrix. The result does not depend on frequency. The final transfer function is supposed to be Vant/Vin. Vant is the unknown voltage between the antenna mast and the counterpoise while Vin is the known voltage between the DUT wiring and the DUT.
The measured capacitances are listed in Table 1. The capacitances are very small. A bridge is formed by the capacitive network, and the output voltage is determined by the difference in capacitance between the DUT components, the antenna rod and ground plane. The ratio of the output antenna voltage to the input noise voltage was calculated to be 0.0044 using capacitance measurements from the scale model. The source impedance was assumed to be insignificant. Each capacitance should be proportionally the same amount to the matching capacitance in the full-size chamber since the model is to scale.
Each element has a big influence in the bridge circuit. One of the biggest drawbacks to this method is the significant potential for erroneous measurements of such small capacitances. For example, rounding the capacitance values increases the voltage transfer ratio by nearly 50%.
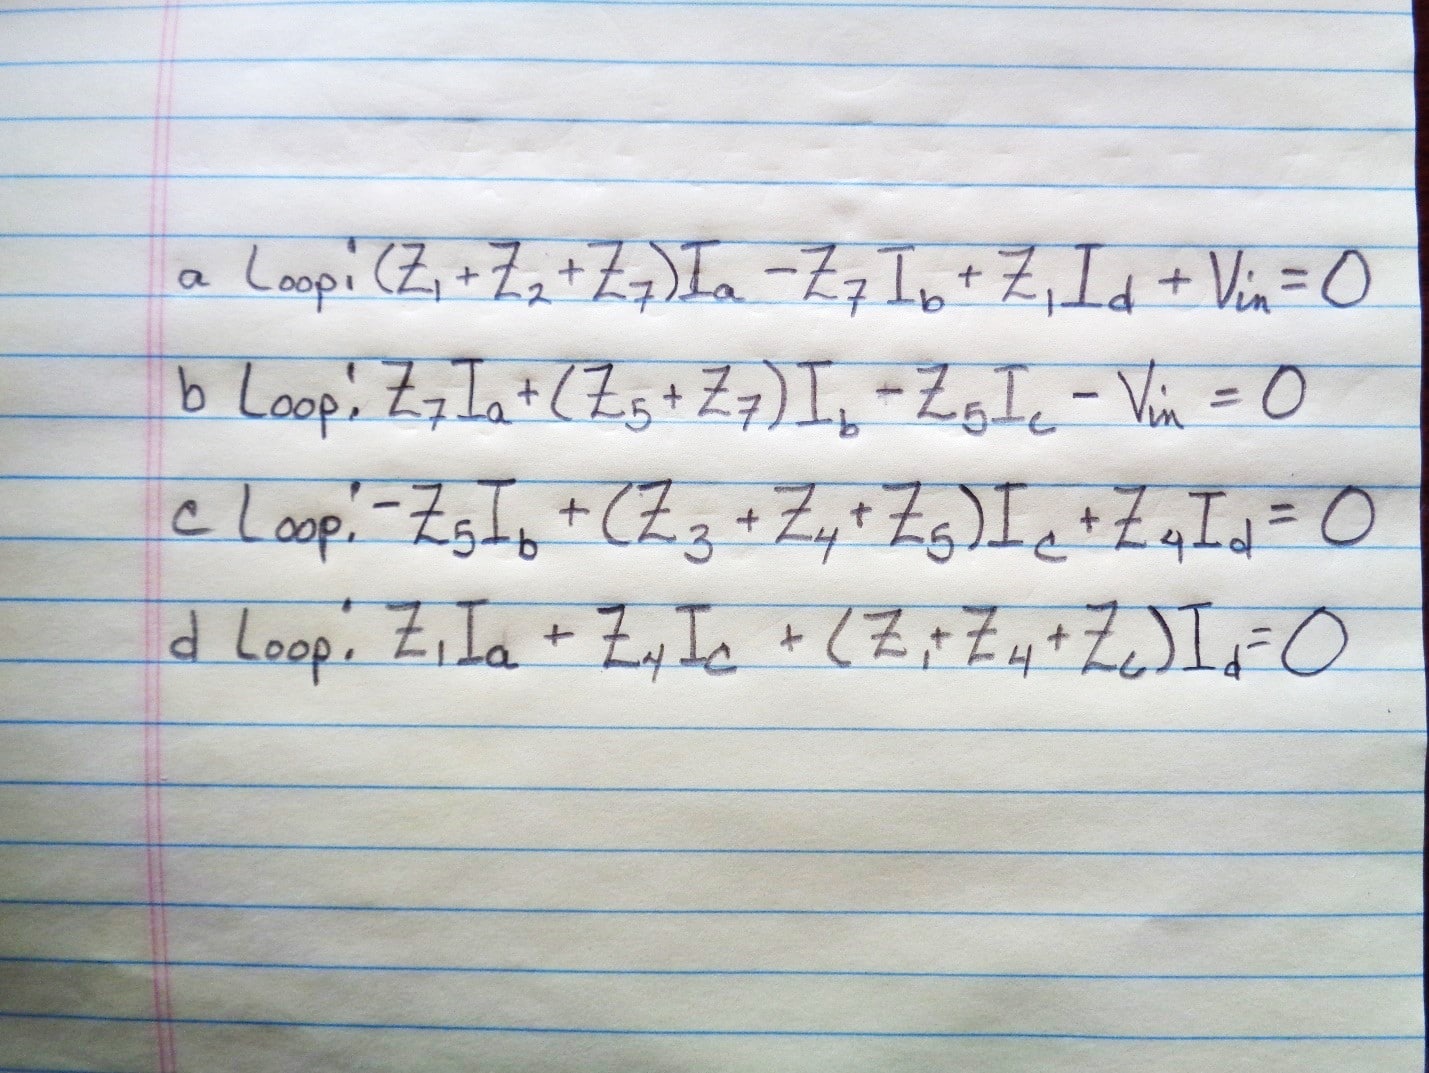
Figure 6. Loop Equations for Kirchhoff’s Voltage Law
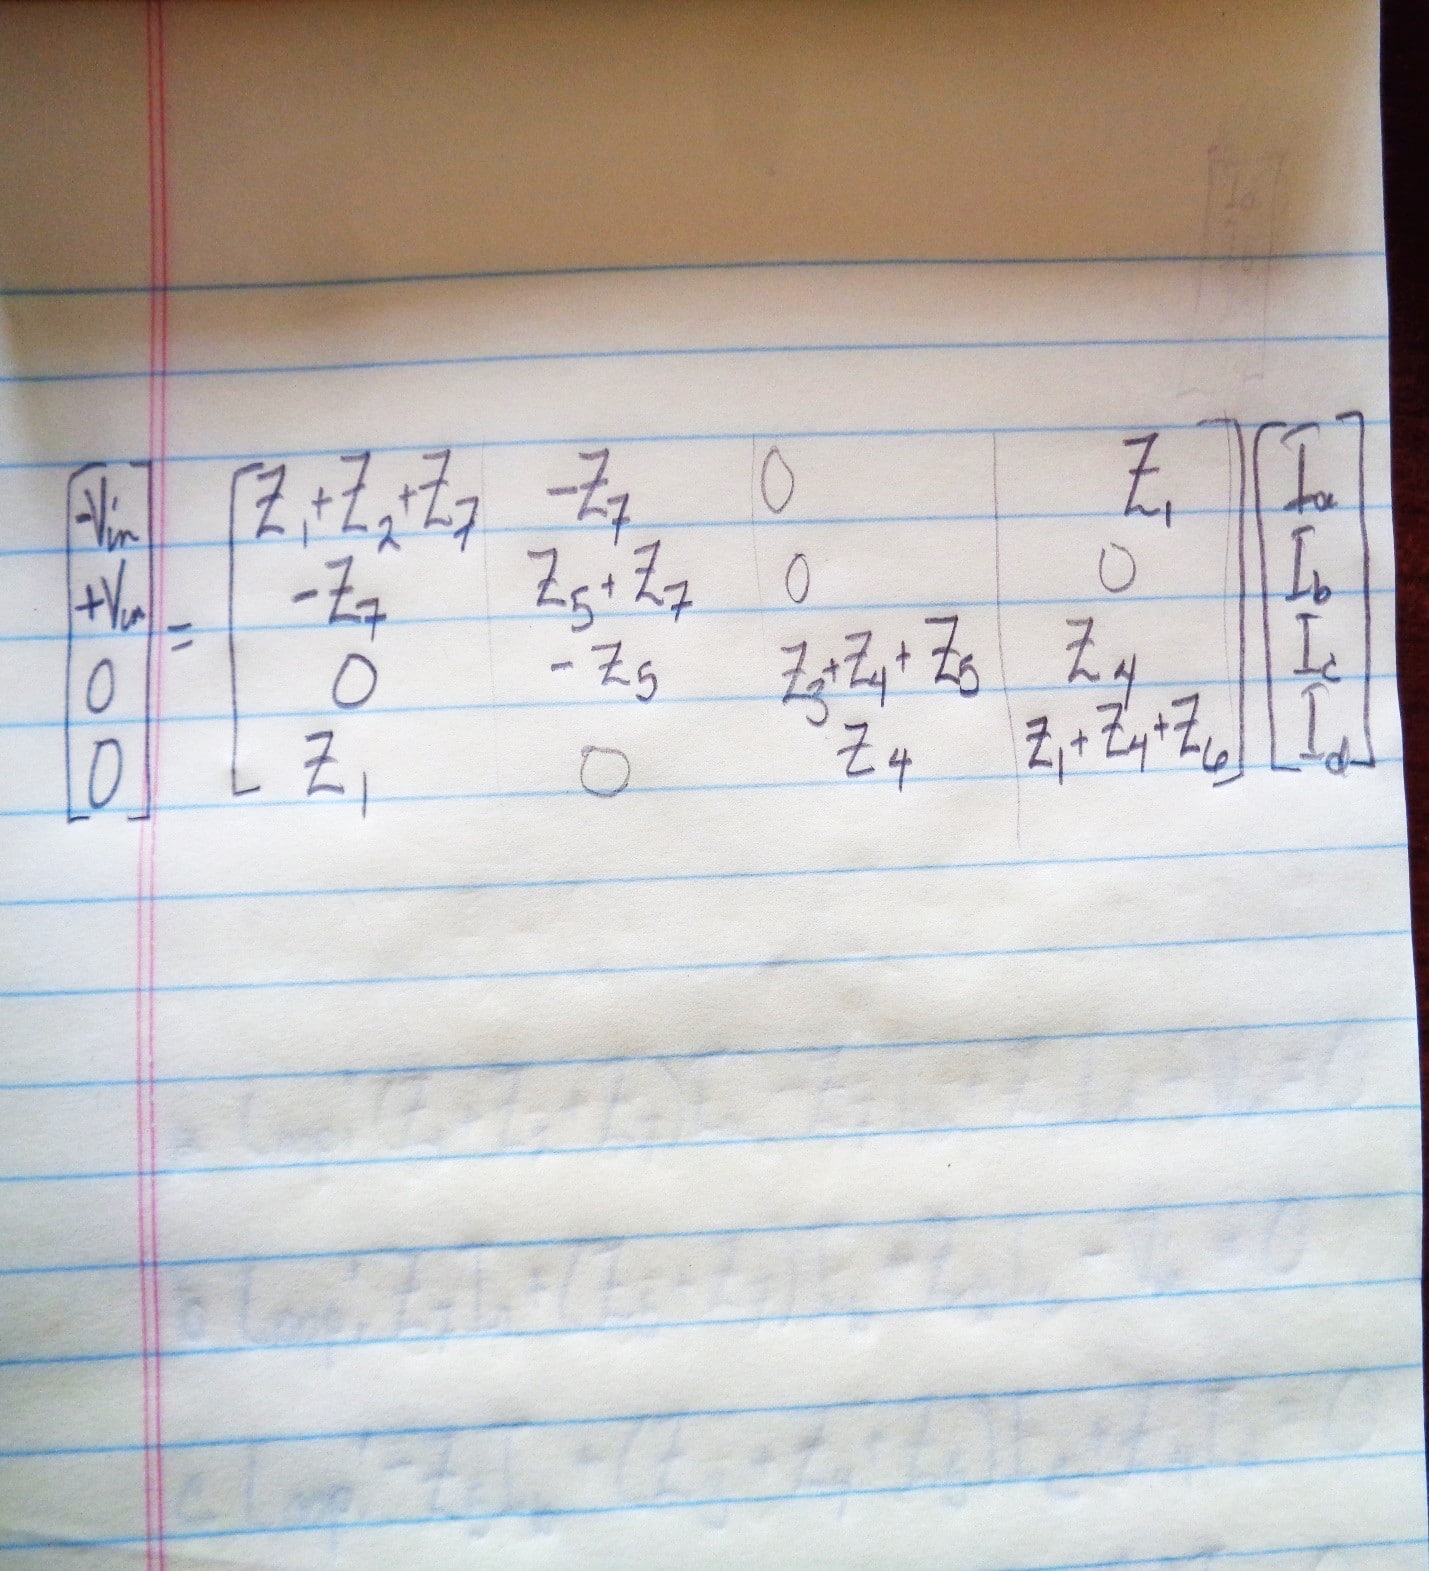
Figure 7. Matrix Equations for Kirchhoff’s Voltage Law (Don’t worry, this is the end of the math!)
Table 1. Measured Capacitance
| Circuit Element | Value |
| C1 | 3.8 pF |
| C2 | 3.7 pF |
| C3 | 14.9 pF |
| C4 | 17.6 pF |
| C5 | 26 pF |
| C6 | 42 pF |
| C7 | —- |
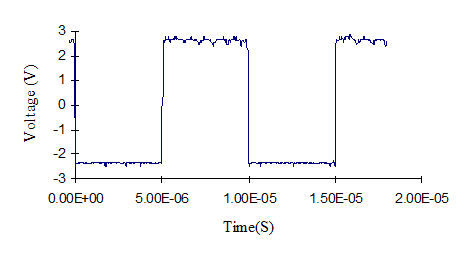
Figure 8. Comb Generator to Wire Voltage
Roger wanted to know if I had done any computer modelling. I said I had made an FEA model using Maxwell 3D to verify the accuracy of the transfer function. Two FEA electrostatic models were built. One had a one wire representation of the wiring harness and the other a two-wire representation of the wiring harness. Interestingly, I had to make the model backwards; I applied a voltage to the antenna and measured the voltage across a 1mm gap placed between the DUT and its harness. To achieve a solution, it was necessary to set the chamber walls to a fixed 0V potential. The base of the monopole and the cable to the monopole are connected to the chamber so they too were set to 0V potential. As with the capacitive network, source impedance was neglected.
One advantage of modeling is that we are not limited by practical constraints on test parameters. With 1000V applied between the monopole antenna rod and base, voltage output between either of the two DUT wires and the DUT was 3.65V. However, voltage between the two DUT wires was only 0.0485V. This justified the assumption that the coupling to the antenna is predominately common mode – only when the voltage of each lead is the same is there a voltage generated in the antenna. It was thus logical to assume that the wiring harness could be represented by only one wire. An additional model with only one wire to the DUT was run, resulting in a voltage of 4.8V. Thus, the FEA predicted a transfer ratio of 0.0048 while the scale model (without expensive licensing fees) predicted a transfer ratio of 0.0044.
A practical test was run using a comb generator. The DUT voltage, Figure 8, was measured. Voltage output from the EMCO 3301B active monopole antenna was also directly measured using an EMI receiver. Since it’s an active antenna, it’s somewhat involved to get the voltage from the measured data. Various factors given in the antenna manual have to be used. The predicted antenna voltage for each voltage transfer ratio is shown in Figures 8 and 9 for the FEA and scale models. The transfer ratio was only able to predict the antenna measurement up to about 5MHz, but was good enough for the long wave and AM bands.
Using a simple factor (about 0.0044), it is possible to predict what the antenna will measure. This can be incorporated into a circuit model of the test device so that changes to the circuit can be evaluated to see if they will allow it to pass the test. This could be helpful for devices with power switching circuits that switch at low frequencies such as 20kHz.
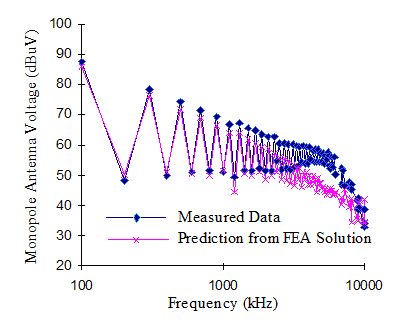
Figure 9. FEA Model vs. Measurements
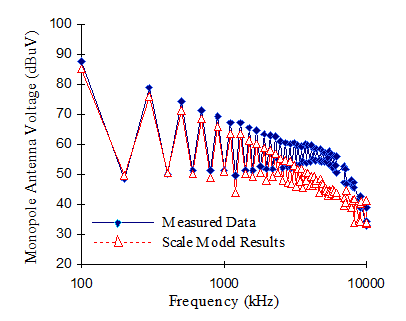
Figure 10. Scale Model Results vs. Measurements
Being an engineer is so fun! When I can use tape and foam board to get the same results as a sophisticated program that solves field equations, it is awesome! It just takes some knowledge of the fundamentals and a good pair of scissors. Hopefully Roger learns the same lesson.
References
- C.R. Suriano, G. Thiele, J.R. Suriano, “Low Frequency Behavior of a Reverberation Chamber with Monopole Antenna,” 2000 IEEE EMC Symposium, Washington, DC, August 2000.
- Henry W. Ott, Electromagnetic Compatibility Engineering, John Wiley & Sons, Inc., 2009, pp. 464-465


