Arthur J. Glazar, Life Senior Member IEEE
Background
Radio frequency (RF) signal energy is normally confined to the interior of a coaxial cable. RF currents on the surface of a cable shield are undesirable and generally indicate a problem. Shield surface currents can occur as the result of conducted susceptibility (CS) or radiated susceptibility (RS). Whatever their cause, shield currents will induce an interfering voltage into the signal-carrying conductor of a coaxial cable through the mechanism of surface transfer impedance. RS testing is often employed to characterize such interference resulting from coupling of a cable shield to an external electromagnetic (EM) field. Because RS testing is complex and costly, however, BCI is an attractive alternative.

Consider the RS test setup shown in Figure 1. Box 1 contains a signal source and Box 2 contains the signal load. The two boxes rest on, and are electrically connected to, a ground plane. A coaxial cable, spaced above the ground plane, carries the desired signal from box 1 to box 2. The two boxes plus the cable comprise a system-under-test (SUT). The presence of a test EM field is indicated symbolically. For simplicity, test and measurement components are not shown.
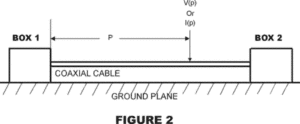
Figure 2 depicts an equivalent BCI test setup. Instead of an EM field, an RF test current is forced onto the shield of the coaxial cable at point p, typically utilizing a current injection probe. The path of the injected current flow includes the entire length of the shield, both boxes and the ground plane.
Briefly stated, shield current causes load noise. Whether the shield current exists as the result of radiation or conduction is irrelevant insofar as observing or predicting load noise is concerned. Load noise can be calculated if the cable’s shield current distribution and its transfer impedance are known. In the discussion to follow, a simple BCI configuration will be analyzed using both a transmission line (TL) model and numerical electromagnetics code (NEC). The results will show that a TL model can be used effectively to analyze BCI.
Transmission Line Modeling
The TL model enjoys the great advantage that its equations can be solved with a variety of tools such as spreadsheets, mathematical software and popular programming languages. On the other hand, the TL model represents an idealization; its limitations must be taken into account when analyzing real systems. Most discussions make similar disclaimers about the limitations of TL modeling without providing details. A goal of this paper is to identify and avoid some limitations of the TL model as applied to BCI analysis.

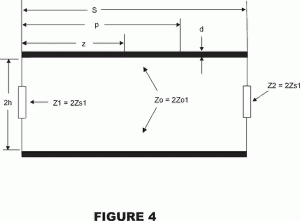
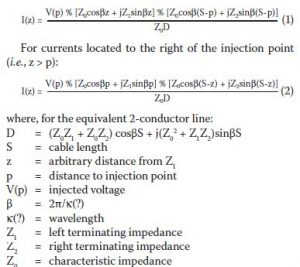
Figure 3 is based upon the analytical approach used by A. A. Smith [ 1]. Zs1 and Zs2 represent the shield terminating impedances at the source and load boxes, respectively. Dimension d represents the outside diameter of the coaxial cable shield. S is the cable length between boxes and h is the cable height above ground. Dimension z is the distance from Zs1 to an arbitrary point on the cable shield. dimension p is the distance from Zs1 to a specified current injection point. TL theory offers, with limitations discussed later, a simple method for finding the current distribution along a cable shield: if the height of the shield above ground, h, is (a) much greater than the shield diameter and (b) much less than a quarter wavelength, then the shield can be treated as a single-conductor transmission line with characteristic impedance Z01 = 60 Loge (4h/d). For example, if h = 100 mm and d = 5 mm, then h/d = 20 and Z01 = 263 ohms. In order to apply classical steady-state transmission line equations, it is convenient to transform Figure 3 into an equivalent two-wire balanced line in free space. This is accomplished by considering the single-conductor line to have a mirror image below the ground plane as shown in Figure 4. In this equivalent, the values of the terminating impedances and the characteristic impedance are all doubled with respect to the physical case represented in Figure 3; that is, Z1 = 2Zs1, Z2=2Zs2, Z0=2Z01. Also, the injected current has a phase-inverted counterpart in the image conductor, and the driving point impedance, Z(p), at the injection point is likewise doubled in the equivalent TL. Let us now stipulate that our model (Figure 4) is lossless, which is a reasonable assumption in most EMC applications, and which simplifies the TL model with little loss of accuracy in practice. In Appendix D of Reference [1], Smith derives equations for the current distribution along a 2-conductor transmission line excited by a voltage source injected at an arbitrary point on the line. The equations are almost tailor-made for our purpose. Smith’s equations (adapted to the notation used in Figure 4) are presented below. For currents located to the left of the injection point (i.e., z < p):
For BCI analysis, it is preferable to have equations (1) and (2) stated in terms of injected current, I(p), rather than injected voltage, V(p). If the driving-point impedance, Z(p), of the TL model is known, then V(p) = I(p) Z(p) (Note 1). To this end, we observe that by setting z = p in either equation and choosing V(p) = 1 for convenience, the equation can be solved to obtain the ratio V(p) / I(p) = Z(p). That is, for V(p) = 1 and z = p, equation (2) becomes
Note that it is only necessary to solve equation (3) once for a given frequency and injection point location; that is, Z(p) is constant under these conditions. Having once found Z(p) therefore, equations (1) and (2) can be re-written in terms of the injected current I(p).
 A program was written in Quick Basic to solve equations (3), (4) and (5). The program, BCI.BAS, generates graphical as well as tabular current distribution solutions and calculates the power input and driving point impedance. The use of BCI.BAS will be demonstrated in the following example. Let Figure 3 represent an SUT having the following characteristics and test parameters (Note 2):
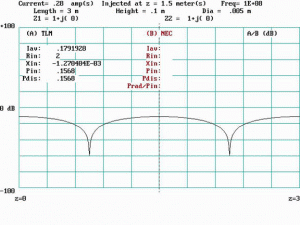
 Figure 5 shows the plot generated by BCI.BAS for the stated problem. At a frequency of 100 MHz, the wavelength is 3 meters, which is exactly the physical line length. We note that if Z1 = Z2 = Z0 in equations (4) and (5), then for all values of z and for all frequencies, the magnitude of I(z) is constant, as it should be, for a line terminated in its characteristic impedance. In our example and in general, however, the transmission line is presented with an extreme mismatch since both shield termination impedances will normally be nearly zero. As a result, a standing wave of current will appear at all frequencies where the TL is long compared to a quarter wavelength. At the injection point, p, the power input is:
where Re[Z(p)] is the resistive component of the driving point impedance. In Figure 5, a current maximum occurs at the injection point, Z(p) = 2 + j(0) and Pin = 157 milliwatts as calculated by BCI.BAS. If instead, the injection point had been located at or near a current minimum (i.e., an impedance maximum), then the power input would necessarily have to be increased to maintain the specified injection current.
It is obvious that the current distribution, driving point impedance and input power will vary dramatically in an actual BCI test during a frequency sweep. Therefore, in planning a BCI test, it is highly desirable to be able to estimate these frequency-dependent variables with some degree of confidence. For the system designer, shield current distribution is important because it directly impacts EMC pass/fail requirements. For the EMC test engineer, however, power input may be more important because it affects test hardware requirements.
Frequency Considerations and Limitations of the TL Model
For a specific TL, frequencies may be grouped into three relative ranges. These ranges can be defined by comparing a quarter-wavelength of the injected current to the TL physical length:
Range 1. Low frequencies. In this range, the TL is shorter than a quarter wavelength and the TL model yields accurate results. If the TL is much shorter than a quarter wavelength, the system can be analyzed using small circuit theory; i.e., Ohm’s Law. For example, at zero frequency equations (4) and (5) reduce to a constant current throughout the line and its terminating impedances.
Range 2. Medium frequencies. In this range, the TL is longer than a quarter wavelength and the TL model yields reasonably accurate results. Ohm’s Law fails because line reflections are not taken into account by small-circuit theory.
Range 3. High frequencies. In this range, the TL is much longer than a quarter wavelength and TL model’s accuracy degrades due to two primary factors: (a) radiation effects are not taken into account; (b) equations (4) and (5) do not account for the length of the terminations at the ends of the line. Radiation primarily modifies the driving point impedance, and termination lengths primarily affect current distribution and resonant frequencies.
NEC Analysis
User-friendly NEC software is available these days for about the price of a hardcover textbook. Radio amateurs are familiar with EZNEC®, a highly-regarded, NEC-based antenna analysis program [2]. The utility of EZNEC (pronounced “Easy-NEC”) extends far beyond antenna analysis, however, and is a valuable tool for the EMC engineer. Readers may wish to browse the EZNEC website where downloads and tutorial material are available.
The SUT depicted in Figure 3, with the parameters from our example, was set up in EZNEC in five steps: First, an infinite, lossless ground plane was selected from the EZNEC menu of ground system options. Second, the cable shield was modeled as three interconnected wires; the 3-meter horizontal section was designated as wire #1, and the left and right vertical drops as wires 2 and 3 respectively. All wires were designated (again, via menu selection) as lossless conductors with a diameter of 5 mm. Third, 1-ohm resistive loads (Z1 and Z2) were added at the center of wires 2 and 3. Fourth, a current source of 0.28 amperes was added to the center of wire #1. Finally, a frequency of 100 MHz was selected and the example problem was ready to run (Note 3). The EZNEC data output options include a table of current magnitude and phase for each wire as well as a graphic display of relative wire currents superimposed upon a view of the wire system. Figure 6 shows the EZNEC graphic for our SUT model. In the figure, numerals indicate wire numbers, circles denote signal sources and squares denote loads. Also note that Smith’s z-axis and EZNEC’s x-axis are interchanged. The present paper, however, adheres to Smith’s notation, where the horizontal plane is the y-z plane and x is the vertical axis.
Comparing NEC and TL Model Solutions
BCI.BAS includes provision for reading EZNEC’s CURRENT and SOURCE data files. The program uses these files to plot EZNEC and TLM solutions on the same graph for direct comparison.
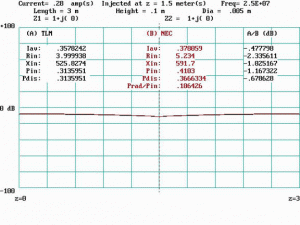
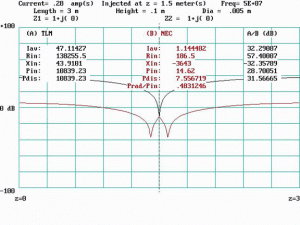
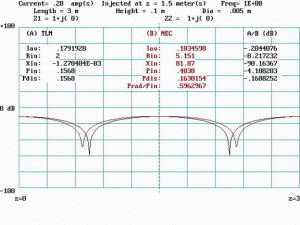
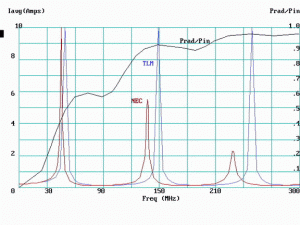
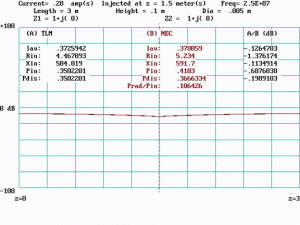
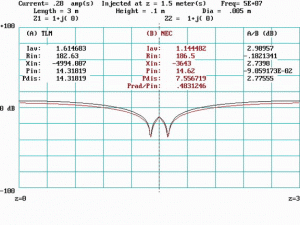
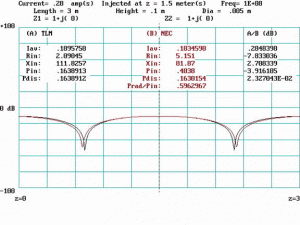
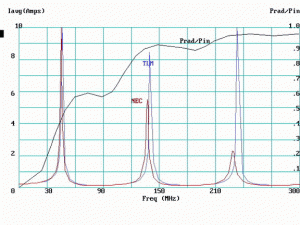
For our SUT example problem, data were taken at more than a hundred frequencies from dc to 300 MHz (Note 4). Figures 7, 8 and 9 were selected from these in order to illustrate particular features of interest. In the figures, TL model solutions (TLM) are in black, and NEC solutions in red. Average currents (Iavg), are calculated for both TLM and NEC and displayed on-screen. Similarly, power dissipated in the shield terminating impedances (Pdis) are calculated and displayed for both. The ratio of radiated power to total input power (Prad / Pin) is displayed for NEC solutions only, since the TL model does
not account for radiated power.
Figure 7 shows the current distribution plot and other data at f = fQ = 25 MHz. The TLM and NEC plots are indistinguishable, and their average currents differ by less than one-half dB. NEC radiated power is less than 10 percent, and the driving point impedances agree reasonably well. The current distribution is essentially uniform (flat), indicating a constant impedance and absence of a current standing wave along the line.
Figure 8 shows data for f = 2fQ = 50 MHz. At this frequency the line is one-half wavelength long and a standing wave of current is apparent. The current injection point coincides with an impedance maximum at the center of the line. Radiated power accounts for about 48 percent of the total input power. Large discrepancies are apparent between TLM and NEC including a triangular hump in the NEC plot that does not appear in the TLM plot.
Figure 9 shows data for f = 4fQ = 100 MHz. At this frequency the line is one wavelength long, and current is maximum at the center and both ends. The current injection point coincides with an impedance minimum. Radiated power is almost 60 percent of the total input power. Average currents agree closely, but there are significant differences between impedance and input power, as would be expected due to the large component of radiated power in the NEC model.
In looking at these “snapshots” taken at discrete frequencies, it might be concluded that the TL model fails to be useful at frequencies above fQ. However, when the data are examined from a different viewpoint, a new picture emerges. In Figure 10, values of Iavg for both TLM and NEC are plotted as functions of frequency from dc to 300 MHz (Note 5). It is immediately apparent that a proportional frequency shift is in effect, causing the TLM data to advance in frequency relative to the NEC data. The total frequency shift is approximately 9 percent. About 6.7 percent of this is believed due to the “missing” lengths of the two shield terminations in the TL model; i.e., 2h. When a frequency substitution is made such that f’ = f ( 1 + 2h / S) = f ( 1.067), the results are as shown in Figures 11 through 14 which should be compared to the previous
Figures 7 through 10. Note in particular, the emergence of a triangular hump at the injection point in Figure 12 that was absent from Figure 8. In Figures 11 through 14, the corrected frequency, f’ is used in computation, whereas the uncorrected frequency, f, is reported on-screen.
In our example EUT, the cause of the remaining 2 percent frequency shift (after invoking f’) is not obvious. It has been observed that although the total frequency shift varies with system geometry, the TL model with the f’ substitution still provides reasonably accurate predictions of BCI shield current within the guidelines previously discussed.
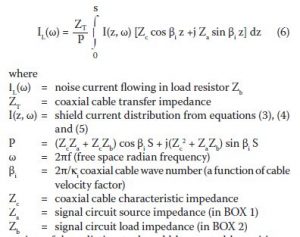
As pointed out earlier, the ultimate objective of using the TL model is to estimate the load noise generated by an injected shield current. Here again, Smith [1] provides the methodology with the following equation:
A useful prediction tool could be created by writing a program around equations (3), (4), (5) and (6). The objective would be to plot load noise vs. frequency, given a limit curve (such as MIL-STD-461E, Figure CS114-1) as an input.
Notes
(1) In Appendix A of Reference [1], Smith independently derives driving point impedance equations. Unfortunately, Reference [1] is currently out of print. Equivalent analyses may be available in other texts such as Vance’s “Coupling to Shielded Cables”.
(2) In this example, the resistive terminations are negligible compared to Zo. In later examples the terminations are helpful in comparing radiated vs. dissipated power. The chosen value of injected current, .28A (109 dBuA), is the maximum level cited in MIL-STD-462/CS114. A compiled and executable version of BCI.BAS is available upon email request to the author.
(3) The problem was ready to run, that is, except for the very important consideration of wire “segmentation”, a topic that is beyond the scope of this paper.
(4) EZNEC’s system of automatic guidelines did not permit running this particular problem configuration below 3.5 MHz.
(5) Figures 10 and 14 were created with a separate plotting program using a text list of data points as the input.
References
[1] A. A. Smith, Coupling of External Electromagnetic Fields to Transmission Lines, second edition, Interference Control Technologies, Inc., Gainesville, VA (1987).
[2] EZNEC Version 3.0, Antenna Analysis Program For Windows, copyright (c) 2000-2002, by Roy W. LeWallen, www. eznec.com.

