A simple, practical mathematical model allows one to relate signal rise-time to the available bandwidth of a measurement instrument.
Mekonen Buzuayene, Anritsu Corporation, Morgan Hills, Calif., USA
In measurement instruments such as oscilloscopes and spectrum analyzers, the maximum rise time (tr) that can be measured with reasonable amplitude accuracy is directly related to the instrument’s -3-dB bandwidth (B).
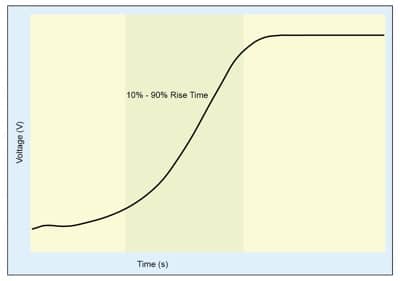
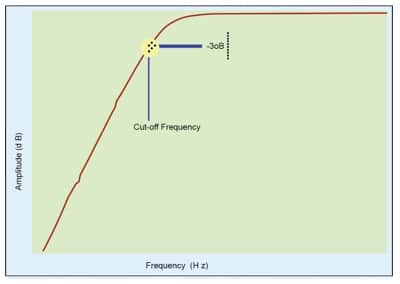
Rise time is usually specified as the transition time for a signal to go from the 10% to the 90% level of the steady maximum value (see Figure 1). However, bandwidth describes the range of frequencies over which the majority of the energy of a signal is contained. Specifically, it is defined as the frequency range over which the frequency response of a signal degrades by 3 dB, assuming a single-pole high-pass frequency response as shown in Figure 2.


 Figure 2. Frequency-domain response of an impulse input.
In an engineering environment it is common to hear people using both terminologies (rise time and bandwidth) interchangeably, depending upon which instrument they are using. The relationships usually included in most oscilloscope catalogs1 and technical discussion handbooks2 are based on the following equation:
tr = 0.35/B (MHz) (1)
The most frequently asked question is: exactly what is the relationship between the time-domain (rise time) and frequency-domain (bandwidth) components of the equation? Or what is the basis of the constant “0.35” for that matter? Or precisely how is this expression derived?
How does the relationship arise?
The best approach to understanding the origin of Equation (1) is to consider an electrical passive filter. This approach provides an exact value. Other methods of analysis could be used instead such as Gaussian distribution or Fourier expansion, but they give rise to errors of 2.9% and 8.6%, respectively.
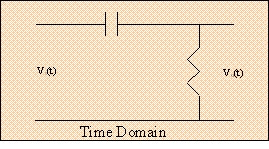
To examine this relationship, we make use of a simple first order system of a low-pass, high-pass, or band-pass. Its topology need not be of any particular structure. It can be in parallel or in series, and its network configuration can also be in any form, such as R-C, R-L, and R-L-C. For the purpose of demonstrating why the tr Equation (1) is accurate, think of a simple R-C schematic as shown in Figure 3, in both the time and frequency domains.
Circuit Analysis
Using the fundamentals of linear circuit analysis and the concepts of Kirchhoff theorems, mesh and nodal procedures will be used to investigate the time-domain and frequency-domain behaviors of Figures 3 and 4.


Time-Domain Analysis
Approach this analysis by writing the respective output equations of the above topologies.
Working through the first order differential equation, we arrive at:
Assuming an input voltage of a unit step function, one can easily determine the speed of response by solving for t.
Solving for t, and replacing RC with the circuit time constant (τ) we get:
With Equation (7) at our disposal, we can now calculate the transitory points of time of the response curve. Widely used measurement points are 10% to 90% levels of the swing.
, and (8)
For
The next step is to solve for rise time (tr) by subtracting (8) from (9).
Having established that the rise time is dependent on τ (which has a frequency component in it), we attempt an analysis from the frequency domain point of view.
Frequency-Domain Analysis
Using a voltage divider approach the equation is:
We also consider power at the output as
Next, we consider the “half-power” frequency, usually termed as (-3 dB) bandwidth. As the terminology would imply, half of the power in the input signal is absorbed by the reactive element of the filter, and the other half is transferred to the output.
Replacing PR by (12), we get:
Again, when we substitute VR by (11), the result is:
The equation is reduced to simple ZC = ZR when all like terms have been canceled. Still, we know that ZR = R and
.
Solving for ω , we get
.
Note that the imaginary (j) is removed by taking the absolute value because phase has no relevance in this analysis.
Where f is the -3 dB cut off frequency of the bandwidth or B (Hz) andRC is the time constant (τ)
Further work results in:
Going back to our last time domain equation (10), and substituting τ with (17), we obtain the most sought after equation of tr.
Alternatively, the above analysis could easily be achieved through an intuitive investigation. Use the half power bandwidth (BW), or cut off frequency (-3 dB) as mentioned previously where the output power is 50% of the input power at the operating frequency with ZC = ZR of an electrical filter.
Since ZC = 1/2πfC, we can then say that at f-3dB ZC = ZR so R = 1/2πf-3dBC. This result leads us straight to 2πf-3dB = 1/RC.
Then, because τ is defined as the RC time-constant, it leads us straight to 2πf-3dB = 1/τ, (also 2πBW = 1/τ) – which is equation (17). In turn, this result leads us straight from equation (10) to equation (18).
Example
Let’s say a signal to be analyzed has a rise time of 10 nsec. The question is what should the minimum bandwidth of an oscilloscope or the minimum resolution bandwidth (RBW) of a spectrum analyzer be?
Plugging the numbers into Equation (18) results in:
What this result implies is that if the bandwidth of an oscilloscope, or the RBW of a spectrum analyzer is 35 MHz, then the fastest signal rise-time that the instrument can display on its screen—without the displayed amplitude being significantly attenuated—would have a rise-time no shorter than 10 nsec.
Similarly, if one wished to measure the amplitude of a 1-ns rise-time signal with reasonable accuracy, the oscilloscope or spectrum analyzer would require a -3-dB bandwidth (or RBW) of at least 350 MHz.
Conclusion
A systematic approach has been proposed for understanding the basics of the equation that relates signal rise time to the -3-dB bandwidth of a system by using both a time-domain and a frequency-domain analysis of a simple lumped-element filter circuit.
This simple but practical mathematical model allows one to relate signal rise-time to the available bandwidth of a measurement instrument. Because of the reciprocal nature of the two variables, the wider the bandwidth of the measuring instrument, the faster is its response time.
A further implication of this result is that for the measurement system to display a reasonably accurate representation of an impulse input signal, its -3-dB bandwidth (B) or RBW must be set to a minimum of Equation (1).
References
- Hewlett Packard Company, Test & Measurement Catalog 1999, printed in the U.S.A. December, 1998, pp. 111.
- Fluke Corporation., ABC’s of Oscilloscopes, printed in the Netherlands 94-36, pp. 8 and 35.


