Introduction
Let’s take on the challenging evaluation of detection and measurement of antenna port emissions – the unintentional emissions that creep through the device circuitry and are presented to the world through an intentional wireless connection. We are NOT going into an in-depth study of antennas and we are NOT exploring what the unintentional signals may reveal. A simple discussion on getting measurements without overwhelming the test equipment while maintaining detection system sensitivity is the plan for this review.
Depending on the device, the CE106 testing can be rather simple or extremely complex. Planning is critical and obtaining specialized equipment may present lead times of 15-20 weeks to establish test configurations appropriate for the evaluation. A lot of detail is involved, and with lot of detail it is very easy to induce minor factors that affect the results.
These test methods have been a part of the MIL-STD-461 test program from the onset appearing under the CE06 numbering with a test frequency range of 10 kHz to 12.4 GHz. This corresponded to the highest equipment operating frequency of 1240 MHz for the Equipment Under Test (EUT). Testing applied to radio frequency (RF) receivers, transmitters and amplifier with a direct connection to an antenna. Some applicability limitations appeared at the initial release exempting this test from equipment with fixed non-removable antennas and transmitters with an average power exceeding 5 kW. If the antenna was permanent, the power exceeded 5 kW or the operating frequency exceeded 1240 MHz, RE03 testing would become applicable in place of CE06. In the early days testing of tunable devices called for testing with the device tuned to three frequencies per octave within each tuning band including within 5% from each end of the tuning band.
With the release of revision “D” in 1993, the numbering updated to CE106 and cited RE103 as the radiated alternative. At the same time, MIL-STD-462D describing the test method was released to support the many changes. As for CE106, the fundamental process remained, but a few changes emerged:
- The test frequency range changed to 10 kHz to 40 GHz but defined test frequency boundaries based on the frequencies used by the test article. Maximum test frequency became 20-times the highest operating frequency up to 40 GHz.
- Testing a transmitter at the fundamental frequency +/- 5% or the necessary bandwidth was not applicable.
- CE106 was not applicable to equipment designed to operate into a non-removable antenna. RE103 was to be used as the alternative.
- Testing of tunable equipment was changed to have the device operating at three frequencies per tuning band (removing the per octave requirement).
- Waveguide connected ports established a lower test frequency boundary of eight-tenths of the waveguide cutoff frequency.
- Non-transmit emissions limit was set at 34 dBµV. The transmit limit required 80 dBc suppression except for the 2nd and 3rd harmonics of the fundamental operating frequency. The 2nd and 3rd harmonics limit was 50 + 10 log p where p = peak power output in watts but not more than 80 dBc.
- During transmitter testing tune the measurement receiver to the transmit frequency and optimize the bandwidth for the maximum indication. Use this bandwidth for the transmit mode testing.
- Implementation of signal integrity checks were associated with the testing to verify the measurement system would correctly measure a known signal through all components in the measurement path.
- Data presentation required graphs with frequency resolution be the lessor of 1% or twice the bandwidth and amplitude resolution of 1 dB.
In 1999 revision ‘E” incorporated a few changes:
- Testing a transmitter at the fundamental frequency +/- 5% and the necessary bandwidth was not applicable.
- Operation of RF amplifiers was added to the procedures indicating that the amplifier specification be used to establish proper operation.
Revision “F” was released on 2007 bringing forth a few updates:
- Testing a transmitter at the fundamental frequency +/- 5% or the transmitted signal bandwidth, whichever is larger was not applicable.
Revision “G” released in 2015 is the current standard and will be used as the basis for the following discussion detailing the test procedures for CE106. Some updates include:
- Additional exclusion was defined for high power transmitters for Navy shipboard applications.
- Established a minimum upper test frequency of 18 GHz for systems that generate or receive frequencies up to 900 MHz.
- Updated the suppression requirements for harmonic other than the 2nd and 3rd for selected applications.
CE106 Receive / Standby Mode
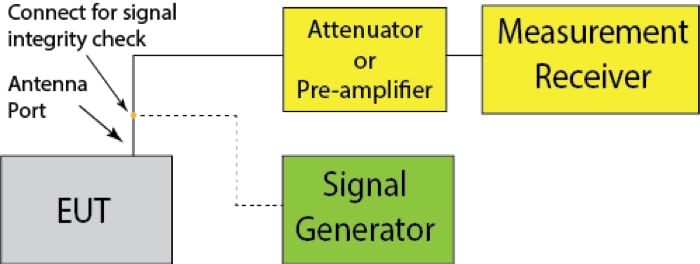
As with most MIL-STD-461G tests, a signal integrity check is accomplished to verify the measurement capability and accuracy of the instrumentation. Select the measurement system hardware to be used for test and configure as shown on Figure 1 with a connection to the signal generator indicated by the dashed line. Normally an attenuator is not required but if high emissions are present from the test article referred to as the Equipment Under Test (EUT), an overdrive condition could be present. In most cases, a pre-amplifier is placed in line to improve the measurement system sensitivity. However, once emissions are being measured the equipment may need changes based on the results and if changed, the signal integrity check will need to be repeated.
Once configured, tune the signal generator to the desired check frequency and the amplitude to a level 6 dB below the applicable limit. Verify that the measurement system obtains an amplitude within 3 dB of the injected signal generator level. If the measurement is not within the required accuracy, correct the problem and repeat the integrity check. The standard calls for repeating check at the end points of the test frequency range. If the testing requires changes to the measurement system hardware such as a pre-amplifier change, the integrity check should be accomplished at the frequency where the change is accomplished with both hardware configurations.

Figure 1: CE106 Receive / Standby Test Configuration
Once the signal integrity check proves successful, the cable is moved from the signal generator to the EUT antenna port to be tested. Establish operation of the EUT at the selected operating frequency and allow stabilization. Scan the measurement system over the test frequency range using the measurement system bandwidths specified in Table II of MIL-STD-461G recording the measured emission levels. Compare the results to the applicable limit to verify compliance with the requirements. Repeat the scan with the EUT operating at each required frequency.
CE106 Transmit Mode
Testing is significantly different in transmit compared to the very straight-forward receive/standby mode testing. The limit development based on the operation, establishing attenuation and rejection of intended signals, verifying proper operation of the EUT and establishing several hardware measurement configurations contribute to the complexity of transmit mode testing.
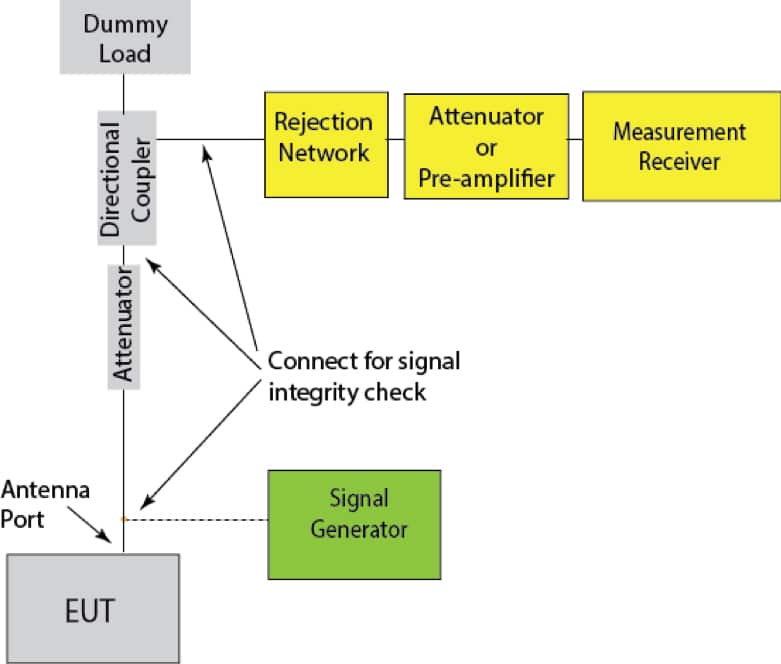
Figure 2 shows a basic concept configuration. In this model, the exact configuration varies based on the transmitter specifications.
The signal path from the EUT provides attenuation to protect the measurement system from a high-power RF intentional transmission if required. This attenuation should be kept to a minimum since unintentional emissions are attenuated by the same amount. This attenuation reduces the sensitivity and could prevent detection of the emissions. A low-power device may not need an attenuator.
Next in line is the directional coupler normally needed for higher-power transmitters. The coupler provides a through-port allowing the transmitter to operate at full power into the antenna or a dummy load dissipating the RF output. The forward power port of the directional coupler provides the EUT output signal at a reduced amplitude. For example, a 20 dB coupler would provide the signal at a level 20 dB lower than the signal at the coupler input. Much like the attenuator, the signal reduction affects the unintentional emissions reducing the ability of the measurement system to detect an emission. Please note that the dummy load or antenna must be present to allow current from the transmitter or the coupler will not function correctly.
The rejection network is next in the measurement system path. This item attenuates the intentional transmission without attenuating other frequencies. Great idea, but realistically the rejection network does have a filter shape (bandwidth) and will attenuate nearby frequencies and will also exhibit parasitic reactance affecting frequencies outside the rejection band. Depending on the rejection filter design a high VSWR (voltage standing wave ratio) could affect the EUT operation if the coupler is not used. Some cases are made without using a rejection network but I find that it is usually necessary to attain the dynamic range required of the measurement system.
The diagram shows that an attenuator or pre-amplifier follows the rejection network. Normally a pre-amplifier is needed to compensate for the attenuation by components up to this point in the measurement system path.
Note that the diagram shows many points where a signal integrity check connection may be appropriate. Depending on the values, a check of individual components may be required. Note that signal integrity checks are needed for each measurement system configuration.

Figure 2: CE106 Transmit Mode Test Configuration
The basic idea is covered but I want to expand the discussion with an example that puts more detail on the test configuration framework.
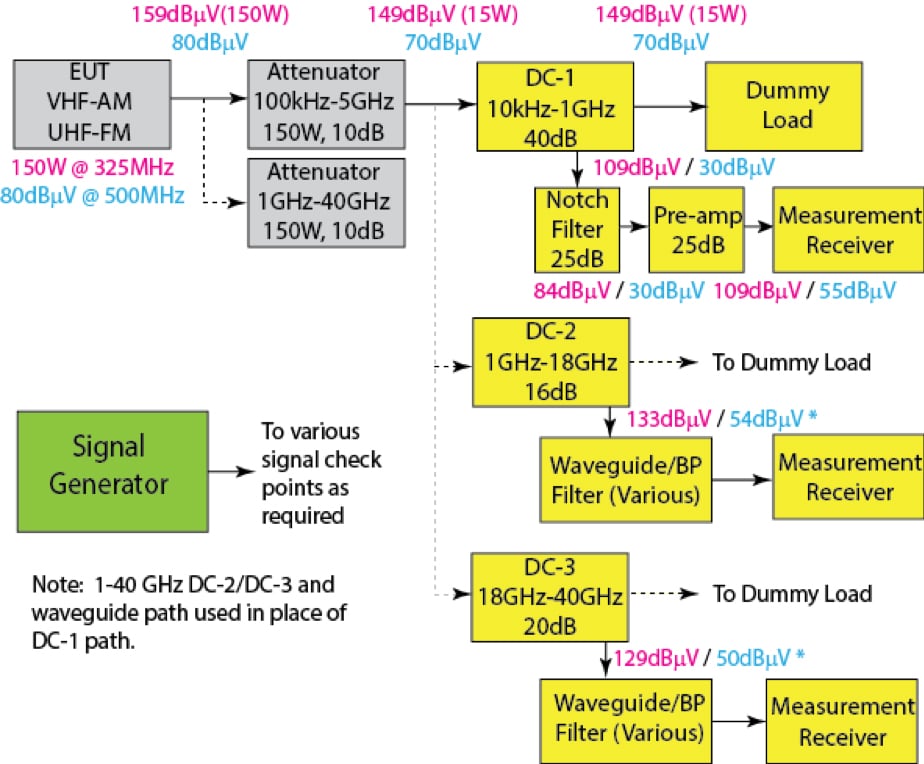
Figure 3 shows a configuration example for case study discussion. In this example, a transmitter is tuned to 325 MHz as the fundamental frequency with an output of 150 watts. To support the discussion we assume that an emission is present at 500 MHz with and amplitude of 80 dBµV. The measurement receiver cannot tolerate the high transmit power at the fundamental frequency, so action is necessary to reduce the intentional signal without reducing the unintentional emission excessively.
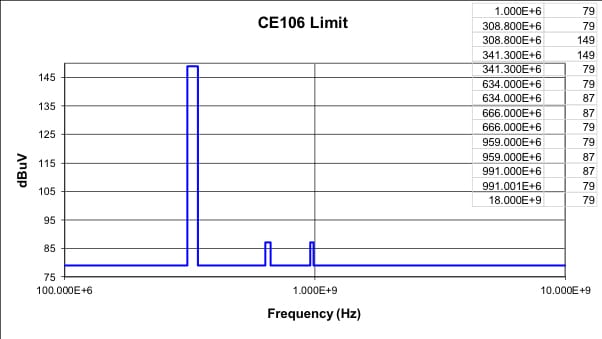
First step – define the limit. The intentional transmission produces a 159 dBµV (150W) signal and the CE106 limit is -80 dBc or 80 dB below the fundamental operating frequency at the 500 MHz emission frequency. Remember that testing at 325 MHz (±5% or ±16.3 MHz) is not applicable but don’t forget that the signal is still present. The emission limit is 79 dBµV except for the fundamental and 2nd and 3rd harmonics. The 2nd and 3rd harmonics have a limit of 87 µdBV (-20 dBm). The frequency range for the 2nd and 3rd harmonics is not specified in the standard, so the test procedure should define this parameter. It is typical to set the 2nd and 3rd harmonic frequency range to follow the fundamental exclusion range or ±16.3 MHz in this case. A case could easily be made to restrict the 2nd and 3rd harmonic range to the necessary bandwidth of the transmission. In either case, you will need to define the range for this limit. Figure 4 provides an example limit for our case study.
In our example configuration, we place a 10dB attenuator first since the available directional coupler is not rated for 150 watts. This attenuator reduces the coupler input power to 15 watts. The coupler through-port is terminated with a dummy load as required to support coupler functionality. The coupler forward port outputs the signal with 40 dB attenuation, reducing the intentional signal to 1.5 milliwatts. The attenuation is also affecting the unintentional emission by the same amount, so we have to consider that we could reduce the unintentional emission below the noise figure of the measurement system and the emission would go undetected.
Next in line is the notch filter serving as the rejection network. This item reduces the intentional signal by 25 dB producing 5 microwatts into the pre-amplifier, but the notch filter does not attenuate the unintentional emission. The pre-amplifier increases the amplitude over the frequency range and we now have at the measurement receiver a difference of 54 dB, well within the measurement system dynamic range. Applying the correction factors to the measurements, we have accurate results for the intentional and unintentional emissions.
This would take care of the test range up to 1 GHz. Note that this is an example and we may not have had to use the specific components or some components could possibly be eliminated depending on the available measurement system components.
Signal integrity checks of the measurement system are accomplished to verify measurements are within 3 dB of a known signal with an amplitude 6 dB below the limit. As indicated previously, the integrity checks may need to be applied for sections of the measurement path because the cumulative attenuation and amplification may exceed the generator capability.
We now need to measure the fundamental frequency to optimize the measurement receiver bandwidth settings – optimize the bandwidth based on the maximum amplitude and then use that bandwidth for testing. After we optimize the bandwidth, we scan the measurement receiver over the frequency range for the hardware configuration.
Recall that the fundamental frequency ±5% is not applicable to test. You probably noted that I included a limit at the fundamental frequency equal to the transmit power level. I think that measurement of the fundamental frequency is a valuable part of the testing. It provides confirmation that the transmitter is operating with the specified output power. If the fundamental frequency measurement is not equal to the limit, the limit should be adjusted to the actual power output. Since we are working in dB this measurement is not very accurate – 150W = 158.76 dBµV and 125W = 157.97 dBµV where the <1 dB difference may not be discernable. This applies to a RF amplifier output too, helping us confirm that the input signal is appropriate for the specified power output.
The notch filter correction curve can affect the shape of the fundamental frequency emission profile often noted by over-limit measurements near the start and end frequencies of the 5% boundaries of the fundamental frequency range. In our example we only provide 25 dB of attenuation in the notch, providing a high level of attenuation by the notch filter and limiting the notch bandwidth is the goal and that can reduce the need for high levels of attenuation affecting unintentional emissions.
Next we configure for the 1-18 GHz frequency range where we place high-pass filters in line to reject the intentional transmission. This could require configuring 2 to 4 high-pass filter arrangements depending the filter performance to allow unintentional emissions to be measured. The same would apply to the 18-40 GHz range if required.
Once configured, the measurement receiver is scanned over the test frequency range for each of the configurations measuring the detected emissions. Now we need to do all this again for another frequency in the tuning band and repeat for the third frequency for that band. Note that a tuning band may be defined by a function such as VHF-AM and UHF-FM being two tuning bands even though the tuning range is covered by a single tuner.

Figure 3: CE106 Transmit Test Configuration Example

Figure 4: CE106 Example Limit
Summary
Planning for transmit mode testing is an absolute necessity to arrange for the measurement system path components with consideration for the test article parameters. Not enough rejection or too much attenuation can easily induce measurement errors that indicate failures or false compliance.
As you can see from our discussion that many components are connected in the measurement path and there are frequent needs to use connector adapters. Each connection includes a certain amount of uncertainty and the cumulative effects can cause a significant measurement error – minimize connections where possible.
The overall test program for CE106 requires many measurement system configurations for transmit mode and testing at several tuned frequencies for the test article so pay attention to the testing.


