Introduction
This article discusses CE101 and CE102, including the updates contained in MIL-STD-461 revision “G”, the current version. The test title for CE101 “Conducted Emission Audio Frequency Currents, Power Leads” and for CE102 “Conducted Emissions Radio Frequency Potentials, Power Leads” provide insight into the test frequency range and methods of measurement. These tests quantify undesired signals being placed onto the power lines from the equipment under test (EUT). If unchecked, these signals conduct via the power distribution to other equipment or radiate into the air for reception by other equipment and may cause harmful interference from either coupling method.
Both of these test methods have been a part of the MIL-STD-461 test program from the onset using CE01 and CE03 numbering. CE01 covered the frequency range of 30 Hz to 15 kHz (20 kHz in MIL-STD-462) and CE03 covered 15 kHz (20 kHz in MIL-STD-462) to 50 MHz. Since both test methods used a current probe measurement technique, the exact frequency transition did not present a major impact. CE01 tests placed the measurement current probe near the power isolator (10µF capacitor or LISN) and CE03 tests located the current probe near the test sample. Similar tests were specified for emission measurements on signal cables to determine if these presented a threat.
CE03 also called for tests to determine if the emissions were classified as narrowband (NB) or broadband (BB). The limits would allow broadband emissions to be higher in amplitude since this kind of noise tended to have a more benign impact to human senses. Compare the sound of wind blowing through trees creating many sound frequencies (BB) to a siren with a single frequency (NB). The wind would permit audio speech and the siren would provide a greater interference to speech. In the early days, interference to radio communications was a dominate problem so the separation of NB and BB had a significant impact on product qualification.
While we are on the BB subject a review on making the decision seems timely. MIL-STD-462 provided two tests to support the decision.
Test one:
- Tune the receiver to the peak signal frequency.
- Adjust the frequency ±2 IBW (IBW is impulsive bandwidth part of the receiver calibration).
- If the amplitude changed by <3 dB the signal was classified as BB.
Test two:
- Measure the pulse repetition frequency of the emission
- If the pulse repetition frequency was less than or equal to the IBW of the receiver the emission was classified as BB.
If either of these two tests resulted in a BB classification, the emission was BB and was compared to the limit to determine acceptance. Let’s not forget that the limit measurement units for BB is dBµA/MHz, so the measurement had to be normalized to the /MHz units by applying a -20logBW in MHz conversion factor. For example if your measurement was using a 10 kHz bandwidth (BW), then -20log(0.01) would provide a 40 dB conversion to conform the measurement to dBµA/MHz units.
Back in the day when these measurements were common, a spectrum analyzer with custom proprietary software to make the NB/BB determination was used and the measurements were plotted on the applicable chart. Today, this process is manual and can be somewhat time-consuming, so when this is applicable to your test program, allow sufficient time for the manual interaction needed.
For a quick assessment, tune receiver to the emission frequency and change the receiver BW by a factor of ten. If the measurement did not change the emission is NB, if the measurement changed by 10 dB the emission is random noise and if the measurement changed by 20 dB the emission is BB. Note that this technique doesn’t follow the standard, so for official measurements use the standard approach.
Time marches on to 1993 for the release of MIL-STD-461D and MIL-STD-462D, changing the testing to CE101 for the 30 Hz to 10 kHz frequency range measured with a current probe and CE102 for frequencies of 10 kHz to 10 MHz measured at the Line Impedance Stabilization Network (LISN) measurement port. This revision also deleted the NB / BB determination requirement and prescribed specific BWs for selected test frequency ranges. Signal line conducted emission testing was NOT included because this version required that cables were exposed during test, so cable radiation could be measured during the radiated portion of the test program.
Limits were established for various applications and voltage level for primary power. Shipboard AC power limits provided for adjusting the CE101 limit based on the EUT current. This made a lot of sense because as the fundamental power current increased, an associated harmonic frequency increase would be expected. Some test personnel would incorrectly adjust the limit based on the current rating. The adjustment should be based on the actual current at the power frequency being drawn by the EUT during test. Now the issue, a similar adjustment was NOT sanctioned for aircraft, making compliance of power frequency harmonics very difficult for high current devices. Although MIL-STD-461 does not provide a limit for ground systems, flight line systems use the limit without adjustment and many non-military systems use this limit. If you encounter this situation, consider making an adjustment by contract or test procedure approval with an adjustment included.
MIL-STD-461E and MIL-STD-461F did not significantly change these particular tests. MIL-STD-461G did incorporate some updates, especially in the arena of signal integrity verification. These updates are included in the following detailed discussion on CE101 and CE102, based on revision “G”, the current standard.
CE101 Audio Frequency Currents
Let’s delve into the lower frequency test range first with the signal integrity verification, where we check the measurement system by creating a known signal frequency and amplitude, then measuring to ensure we obtain the correct values using the measurement system we have selected for test. Adding to the check, the target amplitude should be 6 dB below the applicable limit to demonstrate measurement system sensitivity to detect emissions at that level.
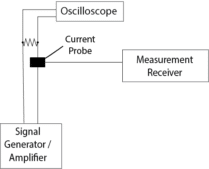
Assemble the signal source for measurement as shown in Figure 1. Selecting “R” is somewhat open but recall that we are going to measure current, so a small resistor value allows current without an excessive potential (voltage). For discussion, let’s select 25 ohms. Next, we determine the target current based on the limit. For the first frequency to be checked, assume a limit of 110 dBµA, so our target is 104 dBµA, or 6 dB below the limit. Converting 104 dBµA to linear units yields 158.5 mA (10^(104/20)). Using Ohm’s law we find that we will need to adjust the signal generator/amplifier until 4V is measured across the resistor to produce 158.5mA flowing in the circuit. Now we simply measure the current and after applying the appropriate correction and conversion factors by the data collection software, we confirm that the measurement is 104 dBµA (±3dB). If the measurement is incorrect, debug steps to uncover the problem are necessary and repeat the check after corrections are made confirms the integrity. Repeat the integrity checks for the other frequencies required by the standard. The standard calls for integrity checks at 1.1 kHz, 3 kHz and 9.9 kHz, which is a change from 1 kHz, 3 kHz and 10 kHz. This change kind of bothers me because it appears that the EMC test community had to be told to slightly change the frequency to prevent the measured signal from being obscured by the graph’s vertical edge line.

Figure 1: CE101 Signal Integrity Check Configuration
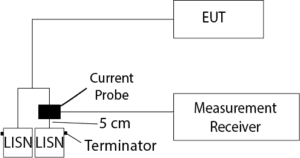
Now we can configure the test item as shown in Figure 2 for testing after successful completion of the signal integrity check. The LISN measurement ports are terminated on both LISNs since we are measuring with the current probe. The current probe is placed 5 cm from the LISN power terminal on the line selected for test.

Figure 2: CE101 Test Configuration
Depending on the application, a limit adjustment may be supported. If this applies, a measurement of the fundamental power will provide the measurement for adjusting the limit. For example, a measurement at 60 Hz results in 127.6 dBµA or 2.4A. Therefore, the limit would be increased by 7.6 dB, the amount above the 1A limit baseline. The adjustment applies to the entire limit line. Create an adjusted limit for use during data collection by the measurement system software.
Now we simply make measurements with the receiver system over the test frequency range and compare to the limit to determine compliance. Move the probe to the remaining power lead and measure the emissions on that lead. Comparing this side to the limit shows that both the phase and neutral emissions are below the limit, so the EUT complies with the requirements. Test complete? A good look at the measurements reveals that the power harmonic emissions are significantly lower on the neutral lead than the phase lead. Harmonic currents are considered normal mode (or differential) so the current going in should return on the other lead, so the lower measurement could indicate excessive leakage current or a wiring issue that provides an alternate current path via a ground connection. This situation needs to be resolved before the test is considered to be correct.
Since we introduced normal mode current, how can we determine if the emission is normal mode or common mode? If you place both the phase and neutral leads through the current probe together and the emission level significantly decreases, normal mode is indicated. A normal mode signal would be 180-degrees out of phase between the two leads and tend to cancel each other when sensed by the current probe.
CE102 Radio Frequency Potentials
As with CE101 we begin the CE102 procedure with the system integrity verification where a few steps have been added in revision “G” of the standard. Recall that revision “G” permitted removing several passive test equipment items from periodic calibration including the LISN. The additional integrity check steps compensate for the periodic calibration with a check that is more comprehensive.
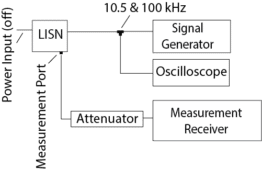
The system integrity check configuration is shown in Figure 3. The process injects a signal into the power line on the EUT side of the LISN to simulate an emission for measurement. The signal amplitude is set for 6 dB below the applicable limit. Please note that the power side of the LISN is not powered or damage to the signal generator is likely.
The signal generator to oscilloscope connection is present for checks at 10.5 kHz and 100 kHz to allow the setting the signal generator amplitude. The oscilloscope measurement is used because the LISN impedance is much less than 50Ω at these frequencies which loads the signal generator, so the oscilloscope provides an accurate measurement of the signal. After the signal amplitude is set, operate the measurement receiver to measure the signal and confirm that the measurement is 6 dB (±3 dB) below the limit
While working with the 10.5 and 100 kHz frequencies, the second part of the check should be accomplished. This part has you disconnect the signal from the LISN and measure the amplitude using the oscilloscope without the loading effects caused by the LISN. The difference between the loaded and unloaded amplitude must conform to values specified in the standard. This validates the impedance of the LISN.
The checks at 1.95 MHz and 9.8 MHz do not require the oscilloscope because the LISN impedance matches the signal generator, so loading does not alter the signal generator setting. After setting the amplitude to 6 dB below the limit, operate the measurement receiver to measure the signal and confirm that the measurement is 6 dB (±3 dB) below the limit. You should remove the “T” and oscilloscope connection to avoid a risk of reflected signals from the cable termination when verifying the higher frequencies.
The attenuator in the measurement receiver path is present to prevent damage from the primary power and the associated transients. When power is initially applied the LISN measurement port capacitor acts like a short circuit until a charge is present and the attenuator suppresses this inrush transient. The standard calls the use of a 20 dB attenuation, but sometimes for special applications a lower value or substituting a transient limiter will improve the measurement sensitivity.

Figure 3: CE102 Signal Integrity Check Configuration
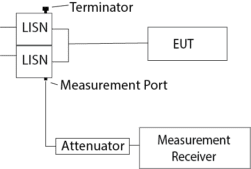
Once all LISNs have been checked you are ready to establish the test configuration as shown in Figure 4. Establish operation of the EUT and operate the measurement receiver system to collect and record emission measurements.
Each line is tested separately and be sure to terminate the unused LISN measurement port to maintain a balanced impedance.

Figure 4: CE102 Test Configuration
Summary
The CE testing is not difficult, but there are many items that can cause flawed data. Consider the results and ask yourself “does this data make sense” and if you doubt the validity, examine for mistakes or simply redo things in question.
The signal integrity checks should not be taken lightly – lots of things are checked in this process from the hardware operation to selecting the correct file for applying correction and conversion factors. Measurement system cables are part of the integrity checks so don’t ignore their influence.
As with any emission testing, make sure that the EUT cycle time is considered. If the EUT takes longer than the minimum dwell time of the measurement receiver, the dwell time will need to be set for the EUT cycle time.


