A new modeling technique takes into account the near-field effect.
Gwenaël Dun and Jean-François Rosnarho
SIEPEL, La Trinité sur Mer, France

The quality of a semi-anechoic chamber for radio-noise emission measurements can be deduced from the difference between the attenuation in an Open Area Test Site (OATS), called Normalized Site Attenuation (NSA), and this same measurement in the test chamber (Figure 1). Th e ANSI C63-4 standard1 authorizes a maximum deviation of +/-4 dB. Numerical modeling techniques can be used for evaluating and optimizing chamber performance.
For high frequencies, analytical or optical methods (ray tracing, for example) are adequate to determine the electromagnetic behavior of a semi-anechoic chamber. (In this case, only the reflectivity of the absorbers and the radiation pattern of the antennas used are required.) For low frequencies, rigorous antenna modeling techniques are needed to take into account the mutual coupling effect. Indeed, the low band performance defines the chamber dimensions.
NEAR-FIELD EFFECT
If the near field zone of each antenna is free, each can be defined as an equivalent fixed source. In the case of 3-meter measurements for low frequencies, theoretical and experimental approaches2, 3 show the significant influence of antennas on measurements because the antennas used for qualifying the chamber are electrically large (resonant dipoles to 200 MHz or biconical antennas). To quantify the error arising from the near-field effect, two theoretical approaches can be compared.
The first one, the Smith, German and Pate formulation (SGP)4 used to calculate NSA in the ANSI C63-4 standard, uses a geometrical approach so the sources (antennas) are fixed. Two paths are considered: a direct path and a reflected one on a metallic plane. In 3-meter measurements, the near-field effect is not considered.
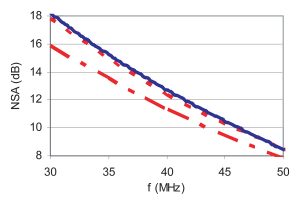
The second approach, the empirical Gavenda formulation,2 takes into account the near-field effect specifically for a resonant dipole. This model shows a deviation up to 2 dB as compared to the SGP model (Figure 2).
A rigorous simulation using the Method of Moments (MoM), appropriate for defining the wire structure of biconical antenna or dipoles, shows the same results as Gavenda’s model.
The attenuation prediction for a test chamber at low frequencies requires modeling both absorbers and the antennas used to factor in the near-field effect (in our case, biconical antennas over the frequency range of 30 to 200 MHz).
ELECTROMAGNETIC SOFTWARE
Chamber simulation can be problematic because of the challenging computational requirements of modeling the different elements—including wavelengths and the comparatively huge dimensions of the chamber itself. Particular care must be taken to render the models with a good degree of accuracy.
A study was carried out to determine the most appropriate of several modeling methods (MoM, FDTD and TLM) for this type of structure. Each of these methods presented different advantages in our simulations. Classical time domain approaches (TLM, FDTD) are interesting for broadband studies and for modeling the frequency dependency of absorber material. Frequency methods (MoM) are appropriate for the simulation of wire antennas.
The “Transmission Line Matrix” method (TLM) was chosen to simulate the chamber because, unlike the classical time domain method, it can easily define biconical antennas and ferrite absorbers, as shown in the next paragraph. This method gave the best results in terms of CPU time and accuracy.
TLM MODEL
An extensive study was made with the TLM method to model the biconical antennas and absorbers to reduce the simulation time of the semi-anechoic chamber with a good degree accuracy.
Absorbers
A compliant chamber was lined with FE30Z ferrite absorbers and HY45 hybrid absorbers (ferrite tiles covered with pyramidal matched absorbers), depending on the operating frequency band.
Ferrite Absorbers
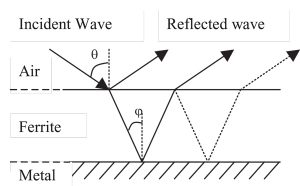
With the use of ferrite absorbers (Figure 3), for all incident angles, the refraction angle is near the norm because of the electromagnetic parameters of ferrite (the modulus of the wave number in the ferrite is higher than 10 under 1 GHz). In this case, the refracted wave in the ferrite can be considered normal to the surface.
With this last approximation, the reflectivity of metal-backed ferrite tiles can be defined by a one-dimensional meshing model in the thickness of ferrite. This step will slightly change the angular dependency of the complex reflection coefficients, but this change is very small.
fn = frequency of pole n.
Δμn = permeability step of pole n.
Unlike Dawson’s ferrite model5 which is based on measured reflectivity, the model proposed here is defined with the electromagnetic parameters of ferrite. To take into account the frequency (f) dependence of the ferrite permeability (m), it can be defined by a third order Debye model (Equation 1);,6 i.e., 3 poles of resonance.
The ferrite model is a boundary condition defined by the frequency-dependent surface impedance of a one-dimensional TLM ladder network for the two polarizations (E field perpendicular and parallel to the air/ferrite interface). This boundary condition takes into account the angle of incidence and the polarization of the electromagnetic wave.
The reflectivity simulation of ferrite tiles up to 200 MHz requires meshing in l/10 or 150 mm with this boundary condition,as opposed to 1 mm in the case of classical TLM meshing. The Courant-Frederich-Levy (CFL) stability criterion imposes a maximum time step that is multiplied by a factor of up to 150.
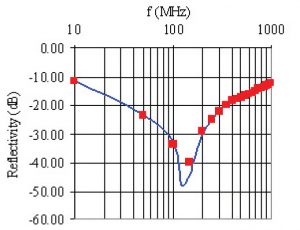
This last parameter and the decrease in the number of meshes significantly reduce the simulation time, with the total error induced in the reflectivity being lower than 1 dB (Figure 4).
Matched Pyramidal Absorber
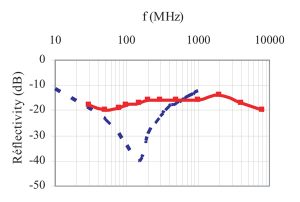
The low carbon-loaded pyramid of a hybrid absorber makes its impact practically negligible in the considered frequency range, but extremely significant in frequencies above 1 GHz. Pyramidal absorbers modify the reflectivity mainly at the ferrite frequency resonance (~250MHz) (Figure 5). Pyramidal absorbers can be modeled by an anisotropic multilayer modelwith an error of under 5% for frequencies up to 1 GHz.
Biconical Antenna
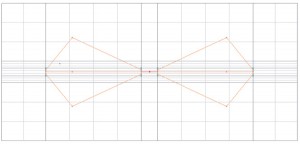
The biconical antennas used, made by SIEBERSDORF (PBA 320), are specially designed for NSA measurements.3 The balun is designed to minimize the height dependency of the antenna factor with an excellent phase symmetry. The impedance presented by the balun to the wires is stable in the frequency range and is equal to 100 Ω. With a specific numerical treatment for wire structures, the inclination of the biconical antenna wires can be modeled without an excessive increase in the number of meshes as compared to a conventional time domain model.

model and measured results for vertical and
horizontal polarization.
The transmission parameters are defined by the scattering parameters of the balun and the simulation results of the wires in its environment for 100-Ω impedance sources (impedance presented by the balun).
The external dimensions of this chamber are 9.20 x 6.60 x 6.20 m3 (L x W x H).
The TLM model provides good correlation with experimental measurements (Figure 7) in both polarizations (especially at critical frequencies).
CONCLUSION
Presented here is a new, efficient TLM modeling technique for determining the NSA of a semi-anechoic chamber. This method takes into account the near-field effect for the frequency range between 30 and 200 MHz. It has been optimized in terms of computer requirements by the use of a metal-backed ferrite tile reflectivity model and a wire model to define the wire structure of the biconical antennas.
REFERENCES
1. ANSI C63.4-2003, Methods of measurements of radio-noise emissions from low voltage electrical and electronic equipment in the range of 9 kHz to 40 GHz. January 2004.
2. J. D. Gavenda. “Near-fi eld corrections to site attenuation.” IEEE Transactions on EMC,Vol. 36. August 1994.
3. W. Mullner, M. Buchmayr. “Introduction height correction factors for accurate measurements with biconical antennas above ground plane,” EMC Zurich 1999. February 16–18, 1999.
4. A. A. Smith, R. F. German, J. B. Pate. “Calculation of site attenuation from antenna factors.” IEEE Transactions on EMC, Vol. 24, No. 3. August 1982.
5. J. F. Dawson. “Representing ferrite absorbing tiles as frequency dependent boundaries in TLM.” Electronic Letters, Vol. 29, No. 9, April 1993.
6. J. D. Paul. “Modelling of general electromagnetic material properties in TLM.” Ph.D. Thesis. University of Nottingham. October 1999.
7. C. L. Holloway, E. F. Kuester. “A low-frequency model for wedge or pyramid absorber arrays – II: computed and measured results.” IEEE Transactions on EMC, Vol. 36, No. 4. November 1994.


