MIL-STD-461 CS101 Test Method Review Authored By:
Soydan Cakir, TUBITAK UME, soydan.cakir@tubitak.gov.tr
Steve Ferguson, Compliance Direction LLC, stevef@compliancedirection.com
Osman Sen, TUBITAK UME, osman.sen@tubitak.gov.tr
Murat Celep, TUBITAK UME, murat.celep@tubitak.gov.tr
1. Introduction
Discussions with various members of the electromagnetic compatibility (EMC) community that deal with MIL-STD-461 testing revealed that various methods were being used to limit the applied power in CS101 testing. The standard calls applying a test voltage level but allows for the requirement to be met if the interfering signal power source is adjusted to dissipate the power curve in a 0.5-Ω load. This review examines test procedures used to accomplish the testing and identifies variances encountered along with considering alternate methods that may be used to meet the goal of the test standard.
2. MIL-STD-461G Procedure
2.1 CS101 Calibration
MIL-STD-461G specifies a calibration configuration as shown in Figure 1. The calibration procedure steps are:
a. Set the signal generator to the lowest test frequency
b. Increase the applied signal amplitude until the oscilloscope indicates the voltage level corresponding to the maximum required power level specified for the limit as shown in Figure 2. Verify that waveform is sinusoidal.
c. Record the setting of the signal source.
d. Scan the required frequency range for testing and record the signal source setting needed to maintain the required power level.
The open issue is what defines the signal source.
One could easily use the signal generator amplitude readout as the setting if the amplifier gain remains stable or does not require adjustment. The range of calibration power through the frequency range often calls for amplifier gain adjustment to maintain operation in the linear region, depending on the amplifier performance. This adjustment need often prompts the use of the amplifier output voltage as the setting to allow gain adjustment and maintain the control setting.
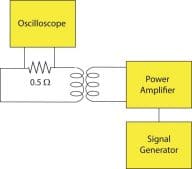
Figure 1: CS101 Basic Calibration Configuration
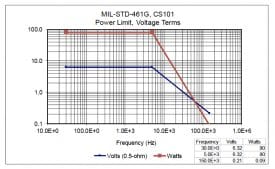
Figure 2: Calibration Power w/Voltage Terms
2.2 CS101 Testing
MIL-STD-461G specifies a testing configuration as shown in Figure 3. The testing steps are:
a. Establish operation in the test configuration.
b. Set the signal generator to lowest test frequency.
c. Increase the applied signal amplitude until the required voltage or power level is reached on the power lead. The test voltage limits are presented in Figure 4 for all devices. On the other hand, power is limited to the level calibrated. (From paragraph 5.72 of MIL-STD-461G—the requirement is met when the power source is adjusted to dissipate the power level as shown on Figure CS101-2 (Figure 2 herein) in a 0.5-Ω load and the Equipment Under Test (EUT) is not susceptible.)
d. While maintaining at least the required signal level, scan the required frequency range while monitoring the EUT for susceptibility.
This procedure calls for monitoring two levels of the applied (test voltage applied and calibrated power) signal and controlling the signal source setting to maintain the applied signal to the lesser of test voltage or calibrated power.
The majority of test facilities involved in the discussion used the either the signal generator output setting or the measured voltage at the amplifier output recorded during a pre-test calibration. The setting is monitored in conjunction with the applied voltage at the EUT to maintain the required test level.
To simplify the process of measuring a relatively low-level interfering signal near the power frequency, some laboratories, in the interest of automating the testing, establish software that simply applies the calibrated voltage setting without regard to the voltage applied to the EUT, which is called “playing back the calibration setting.” This eliminates the need for feedback measurements to serve two control points and meets the requirement of applying “at least” the required signal level. However, this can also result in applying excessive voltage if the characteristic impedance is high or excessive current if the impedance is low.
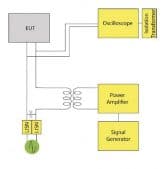
Figure 3: CS101 Basic Test Configuration
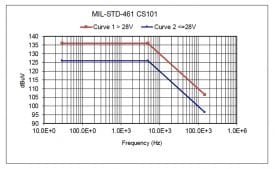
Figure 4: CS101 Test Voltage Curves
3. Test Concerns
The discussions brought forth some concerns that the applied signal level would be different depending on which of the two primary monitoring methods (returning to the signal generator calibration settings or returning to the amplifier output calibration voltage) were used and that the risk of a significant over-test would damage the EUT if the calibration monitoring was omitted during test.
As indicated earlier, using the signal generator setting would omit changes or adjustments of the amplifier that could affect the applied voltage. The range of the limit curve may exceed the dynamic range of the amplifier leading to operation in the non-linear region of the amplifier if the gain remains fixed. This operation could lead to creating harmonic distortion or no amplification of the signal.
Using the amplifier voltage measurement could be affected by regenerative or degenerative feedback via the coupling transformer leading to control settings below the required test level.
With either method there is some risk of inadequate control and differences in the applied voltage preventing standardization of the testing. The magnitude of the difference could depend on the EUT or arbitrary gain settings that are unknown or unable to be controlled.
Some interpret the limit to require that the calibration power be dissipated if the test voltage is not attained. With this interpretation, just for an example, a power of 80 W may be targeted by test technicians and engineers in the test at the amplifier output by means of separate voltage and current measurements when the EUT voltage limit is not achieved. When EUT impedance is too high or low, this method may cause exceeding of voltage or current limits of the used amplifier for sure, subsequently, none of the voltage or power limits can be achieved in the test stage. On the other hand, the limit section (paragraph 5.7.2 of MIL-STD-461G) supports meeting the test level requirement if the power source is adjusted to the level used to meet the power dissipation with a 0.5-Ω load.
This article discusses the testing used to investigate the various methods and the results of the investigation.
4. Equipment Used in the Investigation
The following list identifies the test equipment used in the investigation:
a. EUT—Figure 5 shows a schematic of the simple test article selected for the testing
b. Calibration resistor, 0.5Ω, 80-watts (Solar 9225-0.5)
c. Coupling transformer, Solar 6220-2 (Primary 2Ω, Secondary 0.5Ω, Turns ratio 2:1)
d. LISN—Solar 9233-50-TS-50-N
e. Signal Generator Agilent 33120A
f. PA1—Bryston 7B SST
g. PA2—AE Techron 7224
h. Capacitor, AmpOhm, 10µF
i. OSC1—Oscilloscope, Agilent Infinium 54830B DSO
j. OSC2—Oscilloscope, Agilent 54624A
k. Current probe, Solar 9209-1
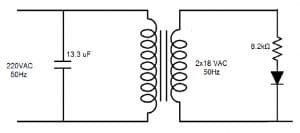
Figure 5: EUT Schematic
5. Test Methods and Results
5.1 General
Figure 7 shows the test and calibration configuration for discussion of the test methods 1, 2, 3, and 4 presented below. The current probe was placed in the coupling transformer primary to obtain current measurements for the investigation.
Figure 8 shows the Method 5 test and calibration configuration with the current probe placed in the secondary side of the coupling transformer. Consequently, Method 5 has only one difference from Method 4 that all the measurements are taken in the secondary side of the transformer.
Two different power amplifiers were used in the investigation and the discussion provides information on the variances between amplifiers. Either amplifier may be present in test laboratories. Many other amplifiers are used but not included in this study.
As per the standard, the power curve presented in Figure 2 must be always used in the CS101 calibration regardless of the EUT type (AC or DC). However, just for comparison purposes, a special power curve reduced by 10 dB and presented in Figure 6 was used in the investigation in order to be able to effectively compare the investigated methods without approaching the upper voltage & current limits of the amplifiers. Although this specially reduced power curve does not exist in the standard, it corresponds to the Voltage Test Curve 2 (see Figure 4) on a 0.5 Ω resistor in fact. As this investigation is mainly based on the comparison of several testing methods, reducing the calibration power was not detrimental to this work’s goal and conversely, yielded the discrepancies between the methods more efficiently by keeping us away from the limits of the amplifier in most of the frequency range.
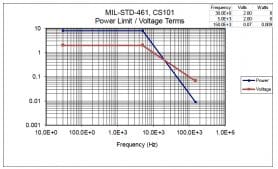
Figure 6: Reduced Special Calibration Power w/Voltage Terms for Comparison Purposes
5.2 Investigation Test Methods
a. Method 1—The calibration was accomplished with the 0.5-Ω load resistor. The signal generator amplitude settings were recorded as the control point maximum in the calibration to be used in the test stage. During the test, the signal generator amplitude settings limited the test when the EUT voltage limit was not reached.
b. Method 2—The calibration was accomplished with the 0.5-Ω load resistor. The voltage at the amplifier/coupling transformer primary was recorded as the control point maximum in the calibration to be used in the test stage. During the test, the amplifier output voltage limited the test when the EUT voltage limit was not reached.
c. Method 3—The calibration was accomplished with the 0.5-Ω load resistor. The power, which was the multiplication of the current and voltage, at the amplifier/coupling transformer primary was recorded as the control point maximum in the calibration to be used in the test stage. During the test, the amplifier output power (multiplication of amplifier voltage and current) limited the test when the EUT voltage limit was not reached.
d. Method 4—The calibration was accomplished with the 0.5-Ω load resistor. The power (multiplication of amplifier output voltage and current) and the current together in the amplifier/coupling transformer primary were recorded separately as the control point maximums during the calibration to be used in the test stage. During the test, the lesser of the amplifier output power or current limited the test when the EUT voltage limit was not reached. Although this method was similar to Method 3, the current was also recorded separately in addition to power to be used in the test stage, unlike Method 3.
e. Method 5—The calibration was accomplished with the 0.5-Ω load resistor. The power and current at the EUT/coupling transformer secondary were recorded although not required as a control point. Although this method was similar to Method 4, power and current were recorded at the secondary winding of the transformer rather than the primary winding.
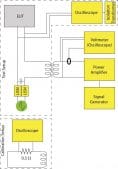
Figure 7: Test/Calibration Configuration Methods 1, 2, 3, and 4
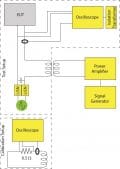
Figure 8: Test/Calibration Configuration Method 5
It should be specially noted here that the voltage measurement port of the oscilloscope was 1 Megohm whereas the current measurement port was 50 Ω as 50-Ω factors of the current probe were used in the work.
5.3 Playback Mode Results (Methods 1, 2, 3, 4)
The playback mode allowed the settings recorded during calibration to be used and the EUT induced voltage was allowed to exceed the test voltage if the EUT characteristic impedance exceeded the 0.5-Ω calibration value. In the playback mode, the EUT voltage level was measured but not used as a limiter in the tests whereas only the other limiting parameters (power and/or current) mentioned in Section 5.2 were activated as limiters.
Figure 9 and Figure 10 show the EUT applied voltage for Methods 1, 2, 3, and 4. Both configurations allowed voltage to exceed the applicable test voltage as would be expected when using the playback option. After ~3.5 kHz this EUT presented low characteristic impedance and prevented the test voltage from being attained for modes 1 and 2. In Modes 3 and 4 an over voltage was applied between ~6.5 and 10 kHz.
It is noted that the Bryston (PA1) amplifier elevated the M1 voltage (see Figure 9) by as much as 6 dB above the M2 test levels expanding the frequency range of the over-test.
5.4 Voltage Limiting Mode Results (Methods 1, 2, 3, 4)
The voltage limiting mode monitored the EUT applied voltage and controlled the settings to prevent a voltage over-test. In this EUT voltage limiting mode, the EUT voltage level was measured and used as a limiter together with the other limiting parameters (power and/or current) as given in Section 5.2.
Figure 11 and Figure 12 show the EUT applied voltage for Methods 1, 2, 3, and 4. Both configurations limited the maximum applied voltage to the applicable test voltage as expected. However, when the test voltage was not attained the applied voltage varied between the modes with M1 and M2 showing a more pronounced difference with the Bryston (PA1) amplifier.
5.5 Voltage Results (Method 5)
Method 5 placed the control measurement in the EUT power circuit with applied voltage and current & power monitoring.
Figure 13 and Figure 14 show the applied EUT voltage with voltage and power and current limiting. Testing was also accomplished in playback mode to assess the potential for over-test.
Both test configurations followed the same curve (exception noted at 36 kHz for PA1) when limiting was active. The applied voltage tracked the test voltage curve unless the current and power limiting became dominant setting the voltage below the test voltage level.
Using the playback mode resulted in a significant over-test.
In addition, it is noted that although we could not reflect it in the curves in Figure 13 and Figure 14 (in the 5 kHz frequency range), the amplifiers reached their limits without producing the EUT voltage or current because the LISN/capacitor resonance caused a voltage drop that exceeded the amplifier capability. This was dominant especially in the playback mode in many frequencies and especially below 1 kHz for both the amplifiers due to the directly seen EUT impedance, in spite of the fact that we used a reduced power curve shown in Figure 6 in the calibration. This reveals great challenges and difficulties in the application of Method 5 because neither the current not voltage limits are attained.
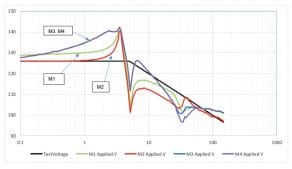
Figure 9: Methods 1, 2, 3, 4, Playback Mode, PA1 Amplifier
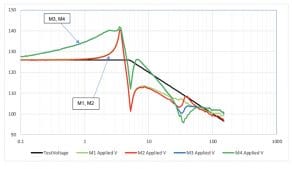
Figure 10: Methods 1, 2, 3, 4, Playback Mode, PA2 Amplifier
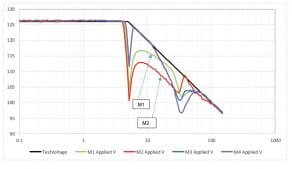
Figure 11: Applied Voltage, Methods 1, 2, 3, 4, EUT Voltage Limiting, PA1 Amplifier
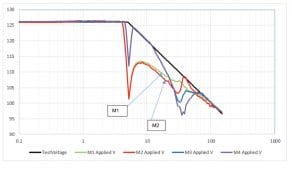
Figure 12: Applied Voltage, Methods 1, 2, 3, 4, EUT Voltage Limiting, PA2 Amplifier
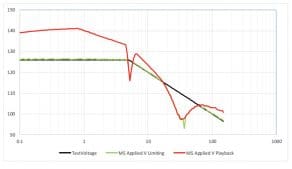
Figure 13: Applied Voltage, Method 5, PA1 Amplifier
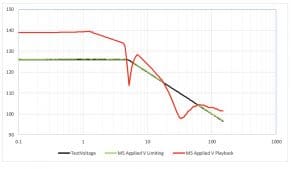
Figure 14: Applied Voltage, Method 5, PA2 Amplifier
6. Conclusions
a. The primary methods currently used (M1 and M2) yield significant differences in the applied voltage and those differences vary based on the amplifier performance. This variance prevents testing from being standardized that could result in a compliant EUT with one amplifier and non-compliant with the other amplifier.
b. Evaluated methods 3 and 4 yield differences with a larger variance than the M1 and M2 variance failing to improve the standardization.
c. Method 5 indicated that amplifier variance was reduced providing a more standardized test. However, the resonant frequency voltage and current issue prevents meeting the test standard requirements. This assumes that the amplifier performance has the capability to produce the required power throughout the frequency range, but an excessive current could cause over-heating of the test circuit or EUT.
d. Playback modes in all cases provided an over-test situation. The over-test could induce an artificial EUT susceptibility that would prompt mitigation by design enhancements driving increased costs.
7. Recommendation
MIL-STD-461 should be revised to provide more detailed procedures to improve the standardization.
Method 5 is recommended with active voltage and power and current limiting being required and the voltage across the mains should be monitored to verify that resonance is preventing the EUT voltage or current. This method does not require pre-calibration with a current limit curve as part of the standard.
About the authors

Soydan Cakir received the B.S. degree in electronics and communication engineering from Istanbul Technical University, Istanbul, Turkey, in 1999, and the M.S and Ph.D. degrees in electronics and communication engineering from Kocaeli University, Gebze, Turkey, in 2008 and 2012 respectively. Since 2005, he has been with the National Metrology Institute (UME), Gebze, where he is currently a member of the Electromagnetic Metrology Group. His research interest includes antenna pattern/factor measurements, electromagnetic compatibility tests/calibrations, and laser spectroscopy.
 Steven Ferguson has over forty years of experience in testing and device evaluation. He has instructed in the area of testing methods for the past twenty or so years focusing on electromagnetic compatibility, product safety and environmental test methods. His comprehensive knowledge of MIL-STD-461, MIL-STD-810, MIL-STD 704/1275/1399 and CE Marking requirements for commercial and industrial equipment provides the ability to discuss the many aspects associated with regulatory compliance. With a background operating test laboratories and manufacturing companies designing products, developing control and test procedures and performing tests he has the experience to address a wide variety of regulatory compliance topics. He presents various courses on EMI/EMC compliance including EMC for Nuclear Power Facilities, Architectural Shielding and MIL-STD-461 testing presented on-line and at customer facilities.
 Osman Sen received the B.S. degree in electronics engineering from Erciyes University, Kayseri, Turkey, in 2003, and the M.S. degree in electronics engineering from Sakarya University, Adapazarı, Turkey, in 2009. Since 2005, he has been with the National Metrology Institute (UME), Gebze, Turkey, where he is currently a member of the Electromagnetic Metrology Group. His current research interest includes electromagnetic compatibility tests/calibrations and laser spectroscopy.
 Murat Celep graduated from the Tekirdag Vocational Schools of University of Trakya in 1992 and then graduated from the department of Electronics and Communication Engineering of Kocaeli University in 1999. He received his M.Sc. degree and Ph.D. degree from the department of Electronics and Communication Engineering in 2004 and in 2013, respectively. He started to work at RF and Microwave Laboratory of TÜBİTAK UME in 1997. He is responsible for performing primary and secondary levels of power, s-parameters, impedance, attenuation, and noise measurements at RF and microwave frequencies, installing and characterizing measurement systems, and uncertainty calculations. He is currently the head of the RF and Microwave Laboratory.


