All methods for validating a test site must provide the same unambiguous result indicating that the site meets or does not meet requirements.
Ken Hall
Hewlett Packard, Roseville, Calif., USA
Site validation above 1 GHz has traditionally been done by extending the ANSI C63.4 Normalized Site Attenuation (NSA) requirements to the upper frequency a customer might request for validation of his site. The “site” was usually an open area test site (OATS) or a semi-anechoic chamber (SAC). With the NSA method, two antennas pointed at each other, and normally, there were no problems encountered. In 1998 the European Telecommunications Standards Institute (ETSI) published ETR 273-21 that included validation methods for anechoic chambers above 1 GHz. Additionally, members of both the American National Standards Institute (ANSI) and Comité International Spécial Suppression Perturbations Radio Électronique (CISPR) working groups determined that the NSA method was not valid because of the directional nature of the antennas used above 1 GHz and that reflection-free conditions (anechoic) were needed. All the proposed methods attempt to identify reflections that could aff ect measurement results above 1 GHz.
INTRODUCTION

This article explores the activities to date and compares the results of the ANSI and CISPR methods when used to verify 3- and 10-meter semi-anechoic chambers. Other chambers have been evaluated using both methods with similar results.

Figure 1 is a simple diagram showing the seven reflecting surfaces one would encounter in an anechoic chamber, on an OATS, and in a SAC; the fl oor would be covered with absorbing materials to create an anechoic, reflection-free, environment.

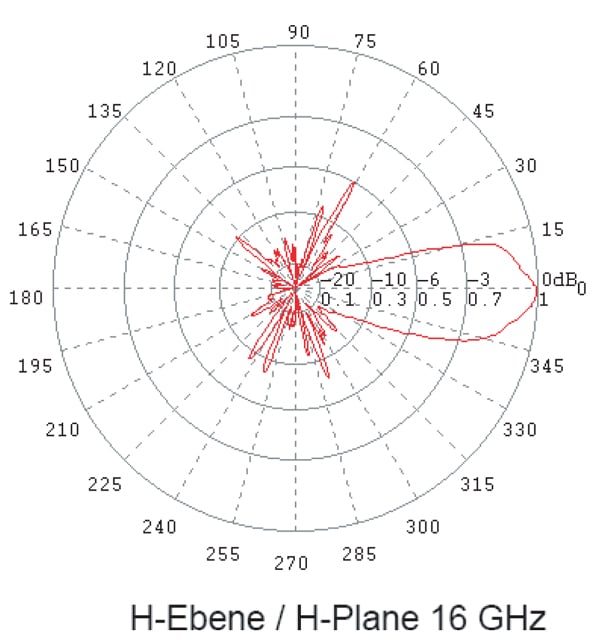
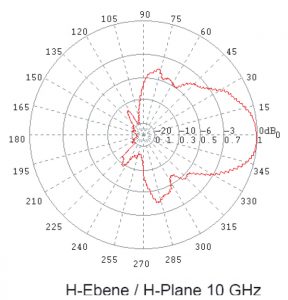
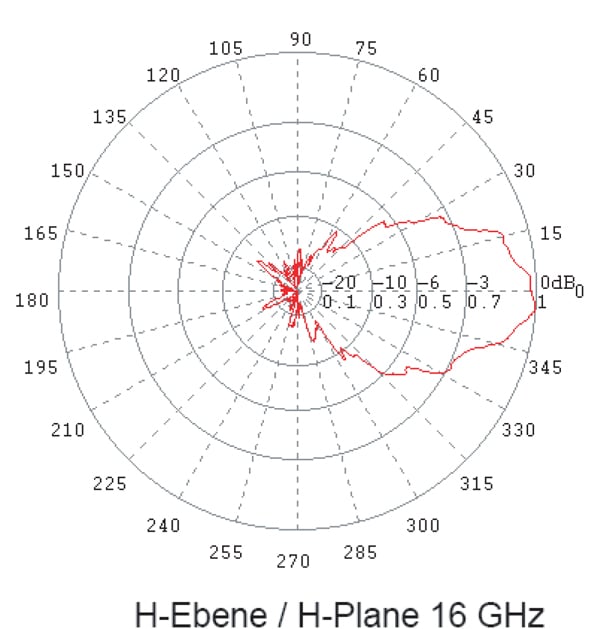
Initial proposals specified log periodic dipole array (LPDA) and double-ridged guide horn (DRGH) antennas. It was determined in a CISPR antenna calibration round-robin2 that both styles of antennas had problems that needed to be resolved. ETR 273 specified a LPDA with a beamwidth of >60 degrees to illuminate all the surfaces. Th e radiation patterns were expected to have a smooth beamwidth pattern. As part of the CISPR round-robin, Schwarzbeck Mess-Electonik plotted the radiation patterns of the DRGH and LPDA antennas. As it turned out, all the antennas evaluated exhibited dramatically non-uniform patterns starting at around 10 GHz. Figures 2a, 2b, 2c, 2d, and 2e are the polar plots of the radiation patterns in the H–Plane (“H-Ebene” is German for H-Plane). In looking at these polar plots, it is clear the DRGHs and LPDAs do not have a smooth pattern and that the LPDAs do not have a beamwidth of >60 degrees.
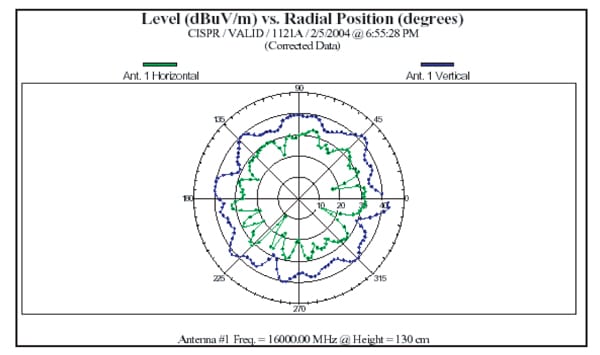
During these early evaluations, both ANSI and CISPR were expecting reflections to be 18.3 dB below the direct, bore-sighted, signal level. Theoretically, this level should provide a less than 1-dB error in measurement uncertainty caused by refl ections. Th e methods evaluated by ANSI and CISPR working groups were similar to this point; although further evaluation methods employed by ANSI and CISPR diverged. ANSI continued to use DRGH horn antennas and looked for refl ections 18.3 dB below the direct signal while CISPR started investigating/evaluating the site voltage standing wave ratio (SVSWR) method using omni-directional antennas. Initially, a conical monopole (Figure 3) was evaluated; at higher frequencies, its radiation pattern was not as omni-directional as needed (Figure 4). In Figure 4, the outer scalloped pattern indicates vertical radiation while the inner scalloped pattern shows horizontal radiation.
ETSI METHOD

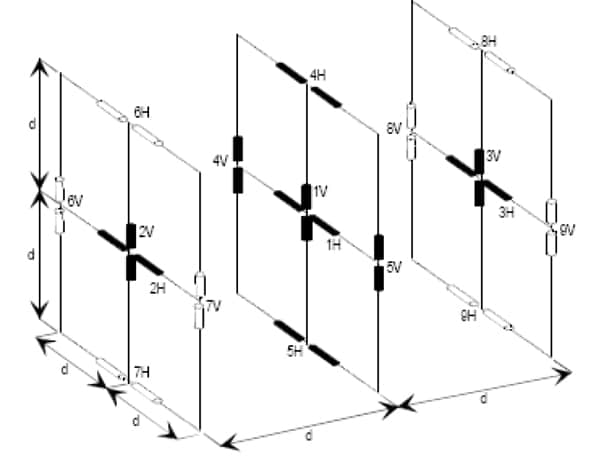
The ETSI method (ETR 273-2) was replaced by ETSI TS 102 321; both methods are complex and very time consuming. The ETSI method uses three 1.4 x 1.4 meter planes, a front plane located 0.7 m in front of the center of the turntable, a center plane located at the center of the turntable, and a rear plane located 0.7 m behind the center of the turntable. Each plane has up to five test locations located 0.7-m apart. As a minimum, ten tests, six in the center plane and two in both the front and rear planes are required (Figure 5). To my knowledge no site has been evaluated using this standard.
CISPR METHOD
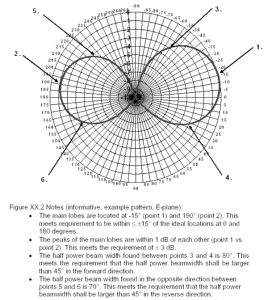
The CISPR SVSWR method requires a transmit antenna that meets the requirements in E-plane (Figure 6) and H-plane( Figure 7). Initially, an antenna meeting these specifications was not available. Two companies, Austrian Research Center (ARC) and Schwarzbeck, developed antennas that meet these stringent requirements. Figure 8 is an overhead view of the groups (labeled alphabetically) and positions (labeled numerically) used for the SVSWR method. With the antennas at 1 meter, in vertical and horizontal, data are collected, and SVSWR is analyzed for each group (Front, Right, Left, and Center) with the receive antenna located at the fixed reference point while the transmit antenna is placed from F/R/L6 to F/R/ L1 in 2-, 10-, 18-, 30- and 40-cm increments. Depending on the size of the test volume diameter, the C group may not need to be measured. If the defined test volume height is greater than 0.5 meters, the test must be done with the transmit and receive antennas at 2 meters. Th e receive antenna shall be the type used for emissions testing.

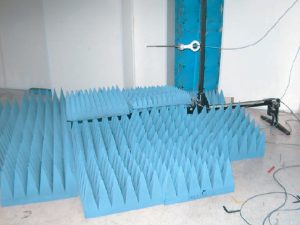
Figure 9 is an SVSWR plot of the 3-meter chamber, from 1 to 6 GHz, with additional absorbers placed on the floor (Figure 10). It appears that more absorbers must be added to improve the performance around 1.3 GHz, based on the findings of the SVSWR method.
ANSI METHOD

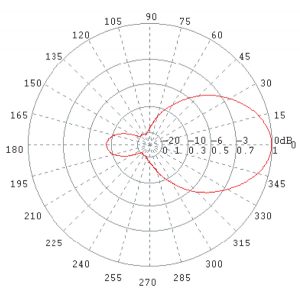
The ANSI method requires rotating the transmit antenna from 0 to 360 degrees in 6-degree increments. Initial evaluations looked promising using a network analyzer and complicated algorithms. When a spectrum analyzer and tracking generator were used, all the chambers evaluated did not meet the requirements. It was determined that the (DRGH) antennas’ back lobe (Figure 11) was about 9 dB below the main lobe which caused the

Figure 12 is a plot of results from the 3-meter chamber, from 1 to 6 GHz, in 45-degree increments, with additional absorbers placed on the floor (Figure 10). When comparing Figure 9 (SVSWR) and Figure 12 (Reflection), notice that the signatures are completely different.
INVESTIGATION
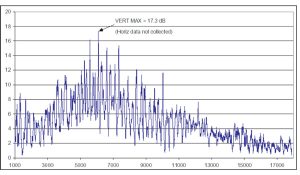
Seeking an explanation for these varying results, we moved to the 10-meter semi-anechoic chamber (Figure 13) to measure the reflections. This chamber met the SVSWR requirements when the ground plane was covered with RF absorbers and did not meet the requirement without the RF absorbers. Figure 14 plots the SVSWR with the RF absorbers, and Figure 15 shows the results without RF absorbers over the ground plane. In looking at Figure 15, we see that the SVSWR exceeds the requirement (5 dB) by about 12 dB while in Figure 16, the reflections are greater than the

The first experiment was to place a piece of 80-cm x 80-cm steel two meters behind the transmit antenna positioned at 180 degrees. In Figure 17, we can see a significant reflection at about – 10 dB or about 8 dB higher than the requirement. This result demonstrates the ANSI reflection method is working as intended, but the “gate” was not set precisely enough to detect the signal from the floor reflection (Figure 1, location 6). The difference in the travel time of the direct signal and reflected ground bounce signal is about 2 nsec so the gate must be set precisely.


In recent evaluations, conducted at an ANSI working group meeting, we evaluated different methods to determine exactly where to set the time gate so as to remove only the back lobe of the transmitting antenna without removing the ground reflected signal. The best method appears to be placing a reflective object (an 80-cm x 80-cm metal plate) directly behind the transmit antenna and then setting the “gate” to remove that response. After setting the gate, verify that a reflection can be identified by moving the reflective object away from the back of the transmit antenna. Then, turn the gate on and off while looking for very little change in the reflected signal level. The ANSI working group is processing the data from three earlier evaluations and have several more evaluations planned.
CONCLUSION
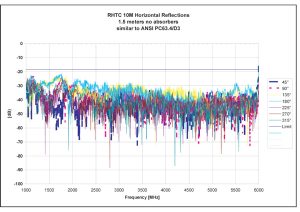
Both methods will identify reflective areas in the chambers tested. The crucial problem that must be resolved is to determine why the ANSI method results in such ambiguous results. Consider that Figure 15 shows results from the 10-meter chamber without absorbers on the groundplane that exceed the SVSWR requirements by >13 dB while in Figure 16, the ANSI method produces a good result with reflections exceeding the 18.3 dB requirements. In Figure 9, in our 3 meter chamber, the SVSWR requirement is marginally exceeded while in Figure 12 (ANSI) there is a decidedly unacceptable result.

In an earlier investigation,3 the author compared the NSA method to the SVSWR method and found the SVSWR method to be more sensitive to site imperfections than the NSA method. As with any standard or benchmark, if there are two methods for validating a test site, they must provide the same unambiguous result indicating that the site meets or does not meet requirements.
The proposed CISPR standard has been approved for circulation as an FDIS (Final Draft International Standard), the last step in becoming part of CISPR 16. Th e most significant change between CISPR/A/602/CDV and the FDIS is that the maximum SVSWR has been increased from 5 to 6 dB.
The proposed ANSI method is still being evaluated.
ACKNOWLEDGEMENT
I would like to thank Dr. Chang-yu Wu. His review comments made this a much better article.
Figures 1, 6, 7 and 8 are from CISPR/A/602/CDV, Figure 5 is from ETSI ETR 273-2:1998, and Figures 2 and 11 were provided by Schwarzbeck.
REFERENCES
1. ETSI ETR 273-2 (February 1998) Electromagnetic compatibility and Radio spectrum Matters (ERM); Improvement of radiated methods of measurement (using test sites) and evaluation of the corresponding measurement uncertainties; Part 2: Anechoic chamber.
2. Ken Hall. “Report on an Inter-laboratory comparison of EMC antenna factors on antennas used above 1 GHz.” 2003 IEEE EMC International Symposium Proceedings. pp. 303-306.
3. Nothofer, M. Alexander, D. Knight. “Radiated RF Measurement Methods and Test Site Validation Above 1 GHz.” 2005 IEEE EMC International Symposium Proceedings. pp 394-399.
Ken Hall can be reached at ken_hall@hp.com.
