The latest tool for serious EMI troubleshooting or debugging has become the real-time (RT) spectrum analyzer. Because manufacturing costs have been decreasing, some RT analyzers are becoming more affordable than ever. In this article, I’ll show you the advantages in using RT analysis for observing and troubleshooting unusual EMI.
INTRODUCTION
First, let’s review the differences between the conventional swept and real-time spectrum analyzers.
Swept-Tuned Analyzer – The swept analyzer uses a tunable local oscillator in a standard superhetrodyne circuit. It can sweep over a specified frequency range and using a user-selected resolution (or “receiver”) bandwidth. RF signals introduced to the input port are mixed with the local oscillator and the specified frequency span is display as RF power versus frequency. The only time data is captured is during the sweep time. After the frequency sweep, the captured data is processed and displayed. There is usually significant delay (or “dead” time) between sweeps, so it’s quite possible for the analyzer to miss capturing intermittent or fast-moving signals.
Real-Time Analyzer – A real-time analyzer uses a stationary LO, looks at narrow windows of bandwidth (real-time bandwidth), and digitizes the incoming spectrum. This digitized spectrum is stored in a time record buffer and held for processing by the FFT algorithm. Ideally, once digitized, FPGAs process FFTs at a rate equal, or faster, than the collection rate. However, this collection rate depends on the span and resolution bandwidth. The major difference between the swept-tuned analyzer and real-time analyzer is the sheer number-crunching ability of the real-time calculation, as well as a fast graphics processor, which allows for a data-dense display of various frequency-versus-time presentations and digital demodulation.
The advantages of a RT analyzer is the ability to capture RF pulses as short as 20 us, digital modulations, and other pulsing or fast changing signals. In addition, they can capture and process data much faster than swept analyzers – there’s no need to wait seconds or minutes to capture a spectrum. This allows very fast troubleshooting, since you can see the result of fixes immediately.
Finally, the RT analyzers have an addition feature called a spectrogram (or “waterfall”) display, where signals are shown versus time. This is a great feature allowing you to determine the timing of intermittent EMI.
I’ll be using the Tektronix RSA306B (Reference 1) real-time USB-controlled spectrum analyzer with Tekbox Digital Solutions (Reference 2) near field probes for this article, but there are many other choices available.
Figure 1 shows a typical advantage of the RT display over that of the swept display. Here, we see some broadband motor noise completely masking several narrow band harmonics. The swept analyzer has trouble capturing the motor noise, but we can see occasional captures indicating there was “something” there. Max Hold mode and waiting a while will help fill in the swept display, but then you’d miss seeing the narrow band emissions.
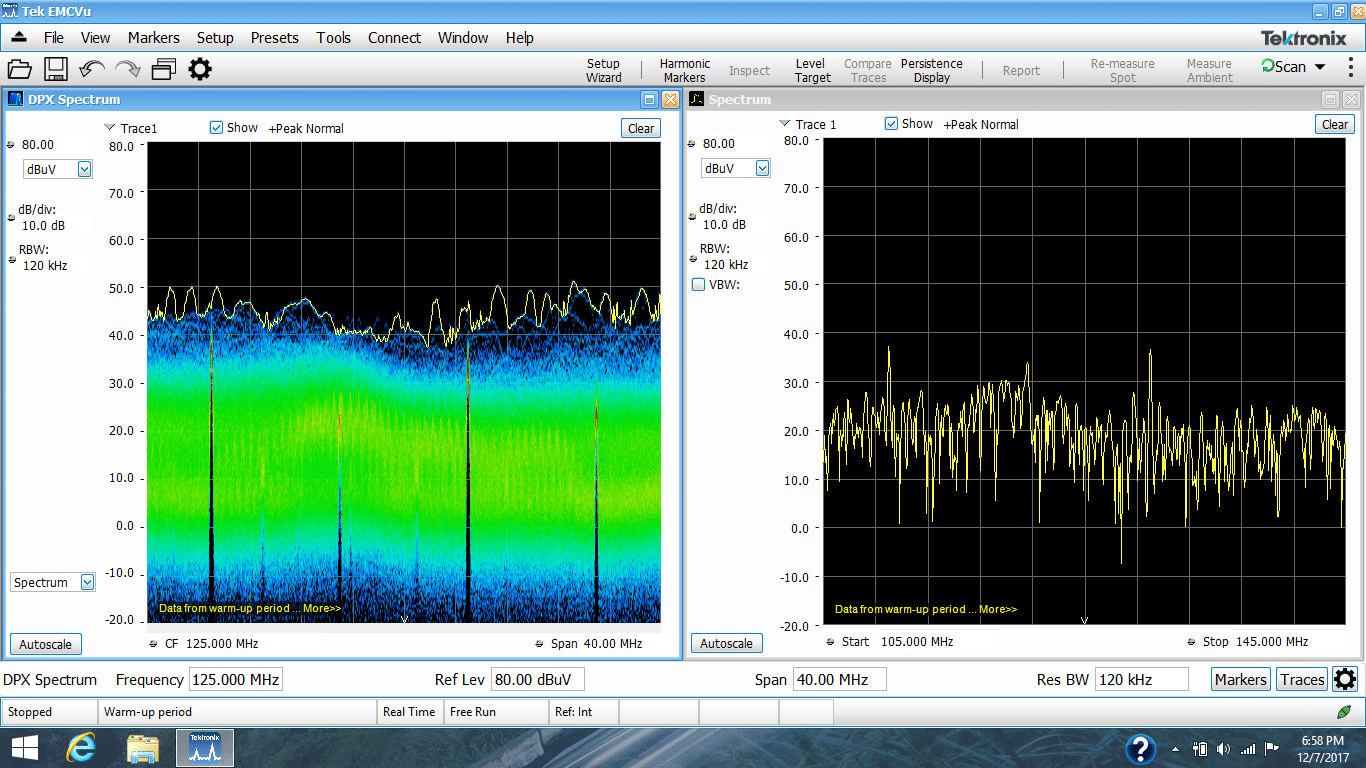
Figure 1 – An example where the broadband emissions from a motor controller completely mask a series of narrow band harmonics. You can see on the right that the standard swept analyzer has trouble capturing this broadband noise.
Most RT analyzers will also have optional EMI software that will help collect data or even perform pre-compliance testing for radiated and conducted emissions. For example, Tektronix offers their SignalVu-PC software with the RSA306B, but also recently announced their EMI troubleshooting and pre-compliance software for the RSA-series, called “EMCVu”. EMCVu includes some impressive EMI troubleshooting and pre-compliance test features and can switch from one mode to the other quickly. It comes with pre-defined transducer factors (antenna and cable loss tables), CISPR and FCC limit lines, and easy report generation. In pre-compliance mode, it can scan the entire frequency range in a few seconds, numbering all the harmonics above the limit and within a certain margin to the limit. These captured harmonic signals can then be examined more closely and then switched over to troubleshooting mode to try various fixes.
Either SignalVu-PC or EMCVu will work fine for basic trouble-shooting or debugging emission issues and I’ve actually used both for this article. If you also want pre-compliance test capability in-house (a wise decision) or more advanced troubleshooting tools, then you’ll want to invest in EMCVu.
THREE-STEP PROCESS FOR EMI TROUBLESHOOTING
I’ve developed a three-step process for EMI troubleshooting, which I’ll briefly explain below. We’ll use Tektronix’ Signal-Vu-PC or EMCVu as an example, but several other companies sell similar compliance software. You’ll want to download the free “2017 EMI Pre-Compliance Test Guide” from Interference Technology for more details on this troubleshooting process (Reference 3).
Step 1 – Use near field probes (either H- or E-field) to identify energy sources and characteristic emission profiles on the PC board and internal cables. Energy sources generally include clock oscillators, processors, RAM, D/A or A/D converters, DC-DC converters, and other sources, which produce fast-edged digital signals. If the product includes a shielded enclosure, probe for leaky seams of other apertures. Record the emission profile of each energy source.
Step 2 – Use a current probe to measure high frequency cable currents. Remember, cables are the most likely structure to radiate RF energy. Move the probe back and forth along the cable to maximize the highest currents. Record the emission profile of each cable.
Step 3 – Use a nearby antenna (I use a 1m test distance) to determine which of the harmonic content actually radiates. Catalog these harmonics and compare to the internal and cable measurements. This will help you determine the most likely energy sources that are coupling to cables or seams and radiating.
ANALYZE THE DATA
Remember that not all near field signals will couple to “antenna-like” structures and radiate. Use a harmonic analyzer tool (see Reference 4) to help identify harmonics belong to specific energy sources. Note that in many cases, two, or more, sources will generate the some (or all) the same harmonics. For example, a 25 MHz clock and 100 MHz clock can both produce harmonics of 100, 200, 300 MHz, etc. Oftentimes, you’ll need to fix more than one source to eliminate a single harmonic. EMCVu includes some powerful data capture and documentation features that will help speed up the data collection process from steps 1 through 3.
After the harmonics are analyzed and you have identified the most likely sources, the next step is to determine the coupling path from source and out the product. Usually, it’s the I/O or power cables that are the actual radiating structure. Sometimes, its leaky seams or apertures (display or keyboard, for example).
There are four possible coupling paths; conducted, radiated, capacitive, and inductive. The latter two (capacitive and inductive) are so-called; “near field” coupling and small changes in distance between source and victim should create large effects in radiated energy. For example, a ribbon cable routed too close to a power supply heat sink (capacitive coupling or dV/dt) and causing radiated emissions can be resolved merely by moving the ribbon able further away from the heat sink. The inductive coupling (di/dt) between a source and victim cable can also be reduced by rerouting. Both these internal coupling mechanisms (or similar PC board design issues) can lead to conducted (out power cables) or radiated (I/O or power cables acting as antennas, or enclosure seams/apertures) emissions.
In many cases, its simply poor cable shield bonding to shielded enclosures or lack of common-mode filtering at I/O or power ports that lead to radiated emissions.
HOW CAN RT ANALYZERS HELP TROUBLESHOOT EMI?
So, let’s turn our attention back to probing the PC board and cables. How often have you probed, troubleshot, and fixed a product only to have it fail at the compliance test facility? Many of today’s products, especially mobile products, include on board DC-DC converters that produce a very broadband EMI spectrum out past 1 GHz that can impact the operation of cellular or GPS wireless receivers. In addition, digital processors can change emission characteristics with time or operating mode. Add wireless features and you have a myriad of potential energy sources that can change emission characteristics with time.
I’d like to demonstrate some examples where swept analyzers might very well miss a bursting increase in emissions or fail to capture broadband EMI that is greater in amplitude than the usual narrow band harmonics we’re all used to.
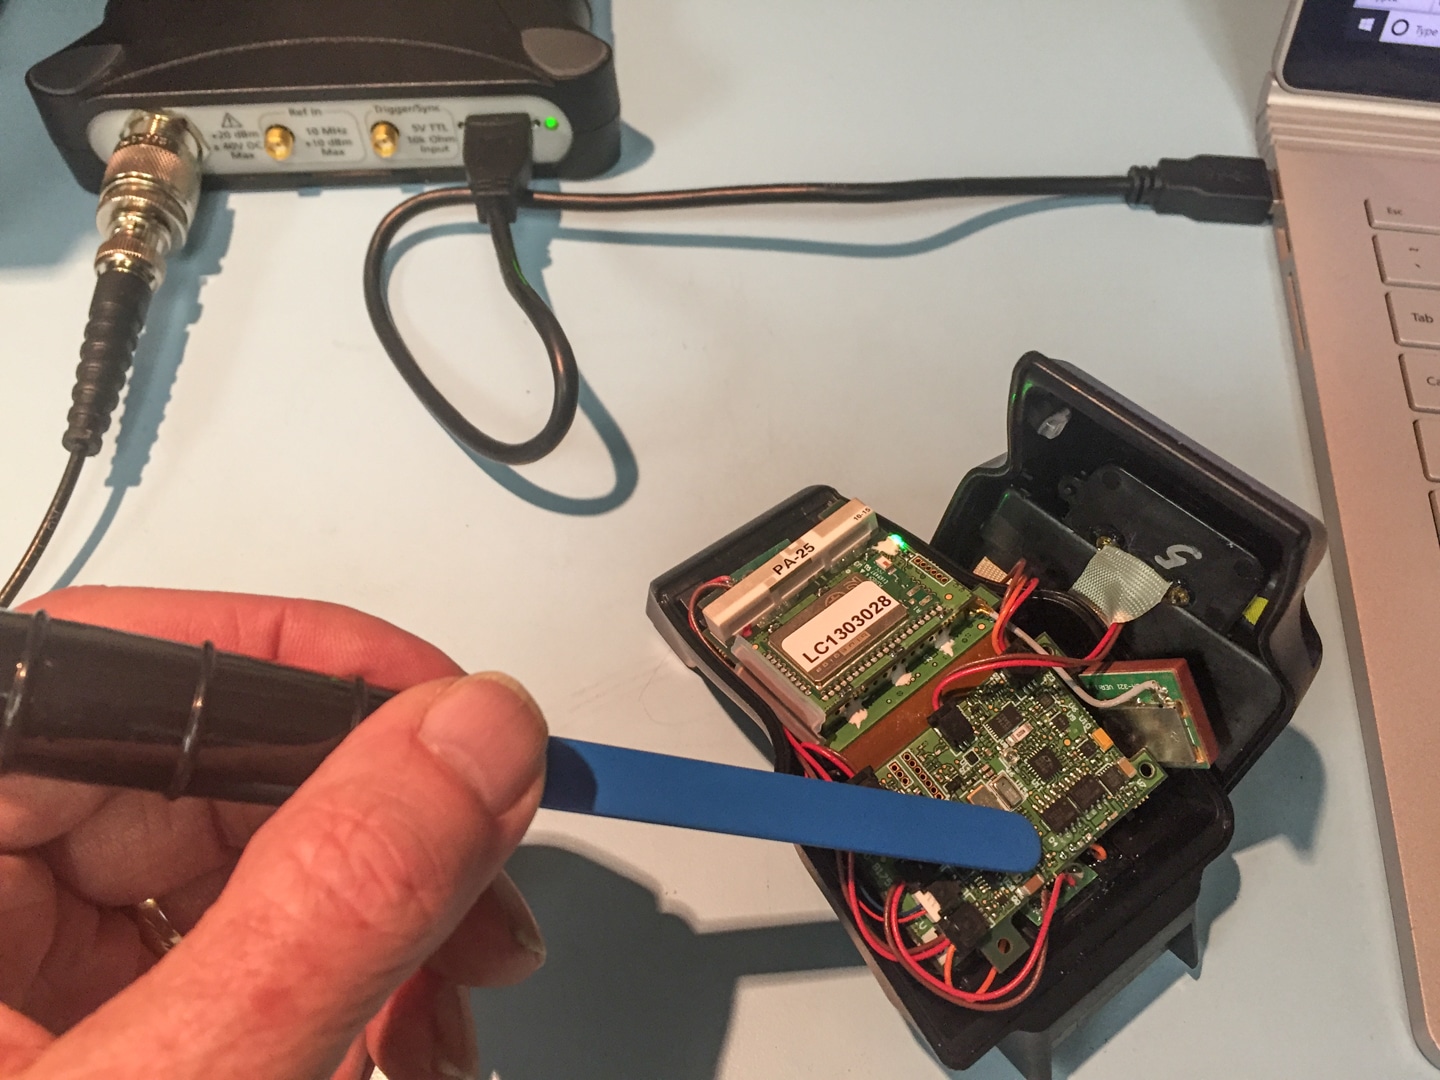
Figure 2 – Using a near field (H-field) probe on an on-board DC-DC converter in a small mobile device. I’m using the Tektronix RSA306B USB-controlled RT spectrum analyzer and Tekbox near field probe.
Example 1 – Pulsating Harmonic EMI
Most of the time, you’ll find narrow band harmonics are relatively stable in amplitude. However, there are times when the amplitude can change, due to gated digital signals or different operating modes. If the harmonic peaks upward at the wrong time, it can lead to compliance failures.
Swept analyzers can easily miss these infrequent amplitude peaks. Placing the swept analyzer in “Max Hold” mode can help, but it could take several minutes to capture the peak of the emission. Even so, peaks can be missed, due to dead time in between scans.
RT analyzers, on the other hand are adept at capturing fast changing signals. Here’s an example where I was measuring the narrow band low frequency emissions from an on-board DC-DC converter on a small mobile device (Figure 2).
In Figure 3, we’re looking from 9 kHz to 10 MHz and we see the swept measurement is even having a hard time capturing the regular peak emissions, while the RT measurement captures the peaks easily and even detects an occasional six dB pulsing increase in amplitude (as shown in the blue persistence display). That infrequent pulsing amplitude increase could easily cause a compliance failure should it couple out through conduction or radiation.
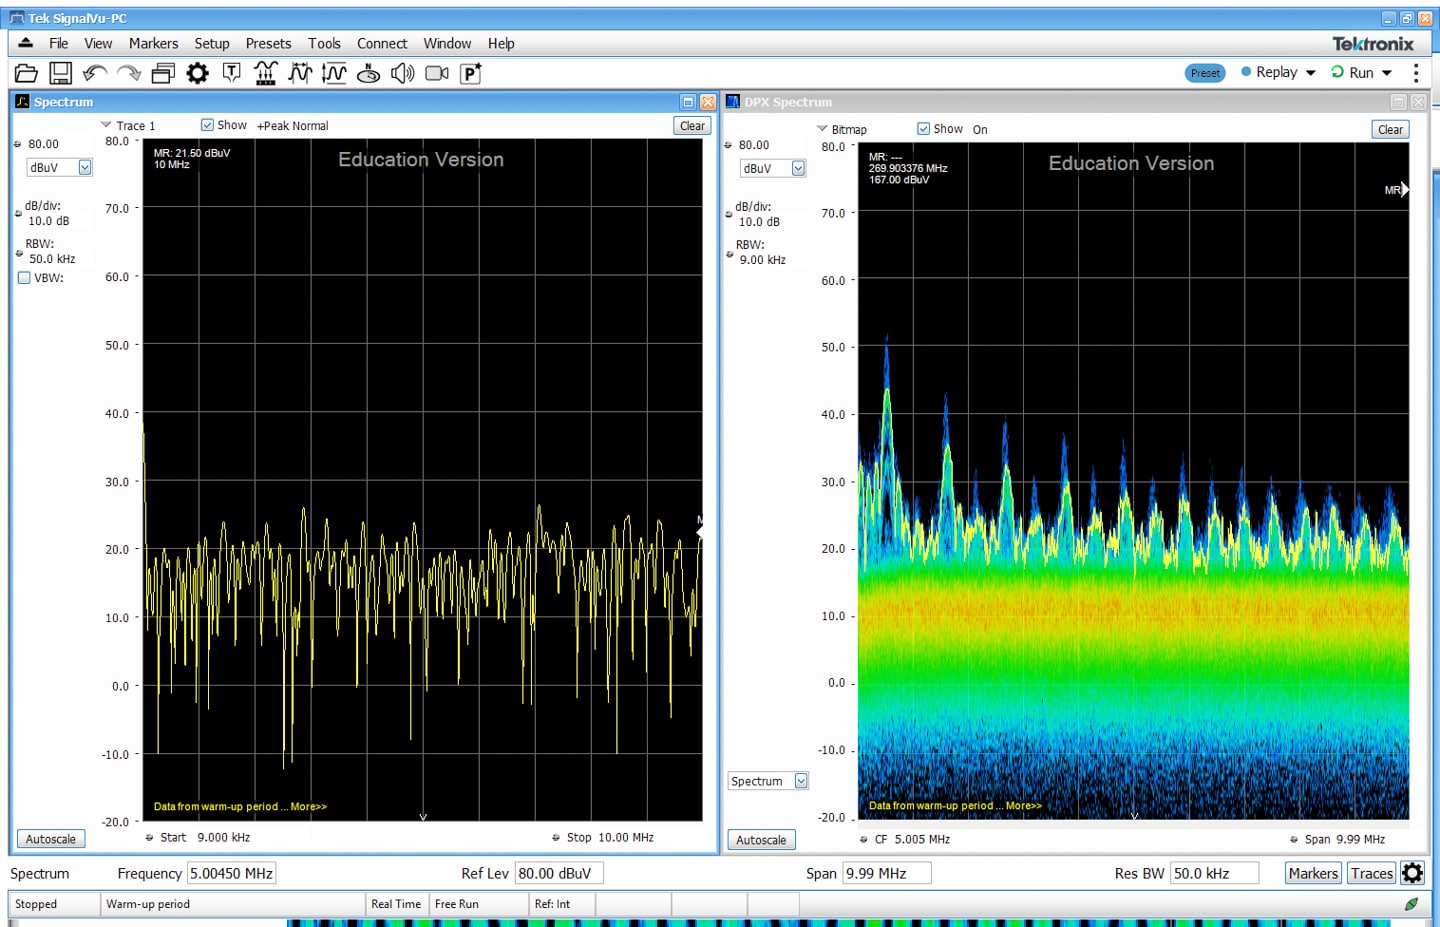
Figure 3 – Measuring the emissions from an on-board DC-DC converter and comparing swept (left) and real-time (right). Note the 6 dB peaks in the blue persistence display.
Example 2 – Identification of Emissions Due to Different Operating Modes
In this example, we’re measuring that same DC-DC converter (Figure 1), but looking from 105 to 145 MHz, a frequent area of compliance failures due to radiated emissions. The surprising result was the three very different spectral responses, due to different operating modes of the mobile device. In some cases, the emission was about 25 dB higher than the swept measurement could capture. Now, would you be willing to take the risk that the swept measurement at the compliance test facility would either miss or manage to capture this should it couple out and radiate?
Figures 4, 5, and 6 show the three different spectral modes. Notice that the swept measurement managed to capture only two of the three spectrums. The near field probe was not moved during this sequence. Each mode was instantly viewable as the state changed from one mode to another.
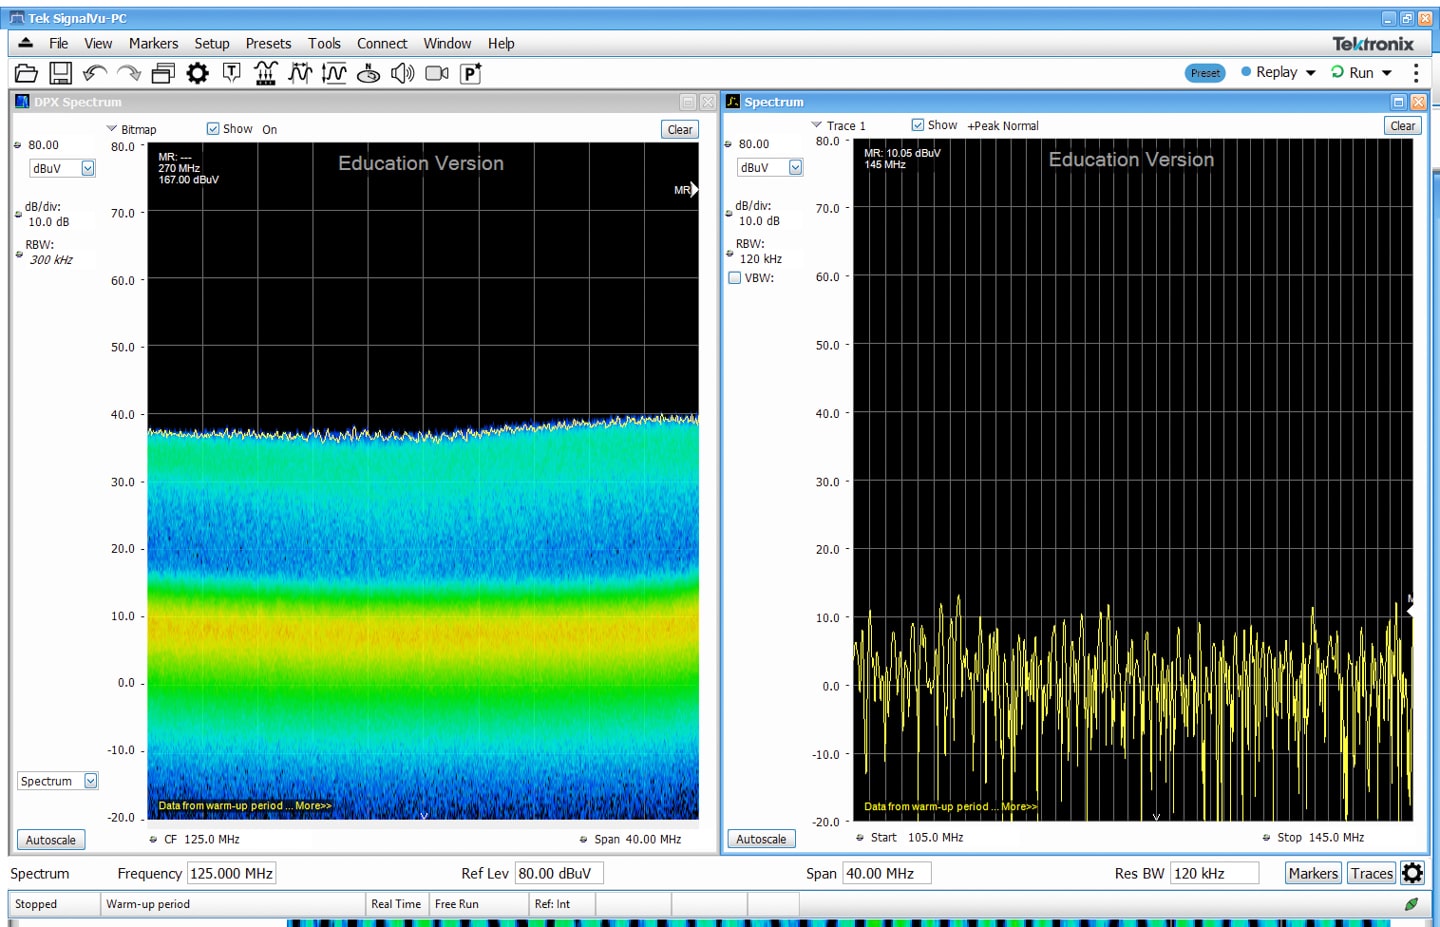
Figure 4 – Broadband emissions from the DC-DC converter looking from 105 to 145 MHz. The swept measurement on the right was unable to successfully capture this, except for an occasional burst. Max Hold mode would have helped, but would have taken at least a minute to “fill in” the display. But once the display was filled in, you may not have been able to see the following two very different modes in Figures 5 and 6.
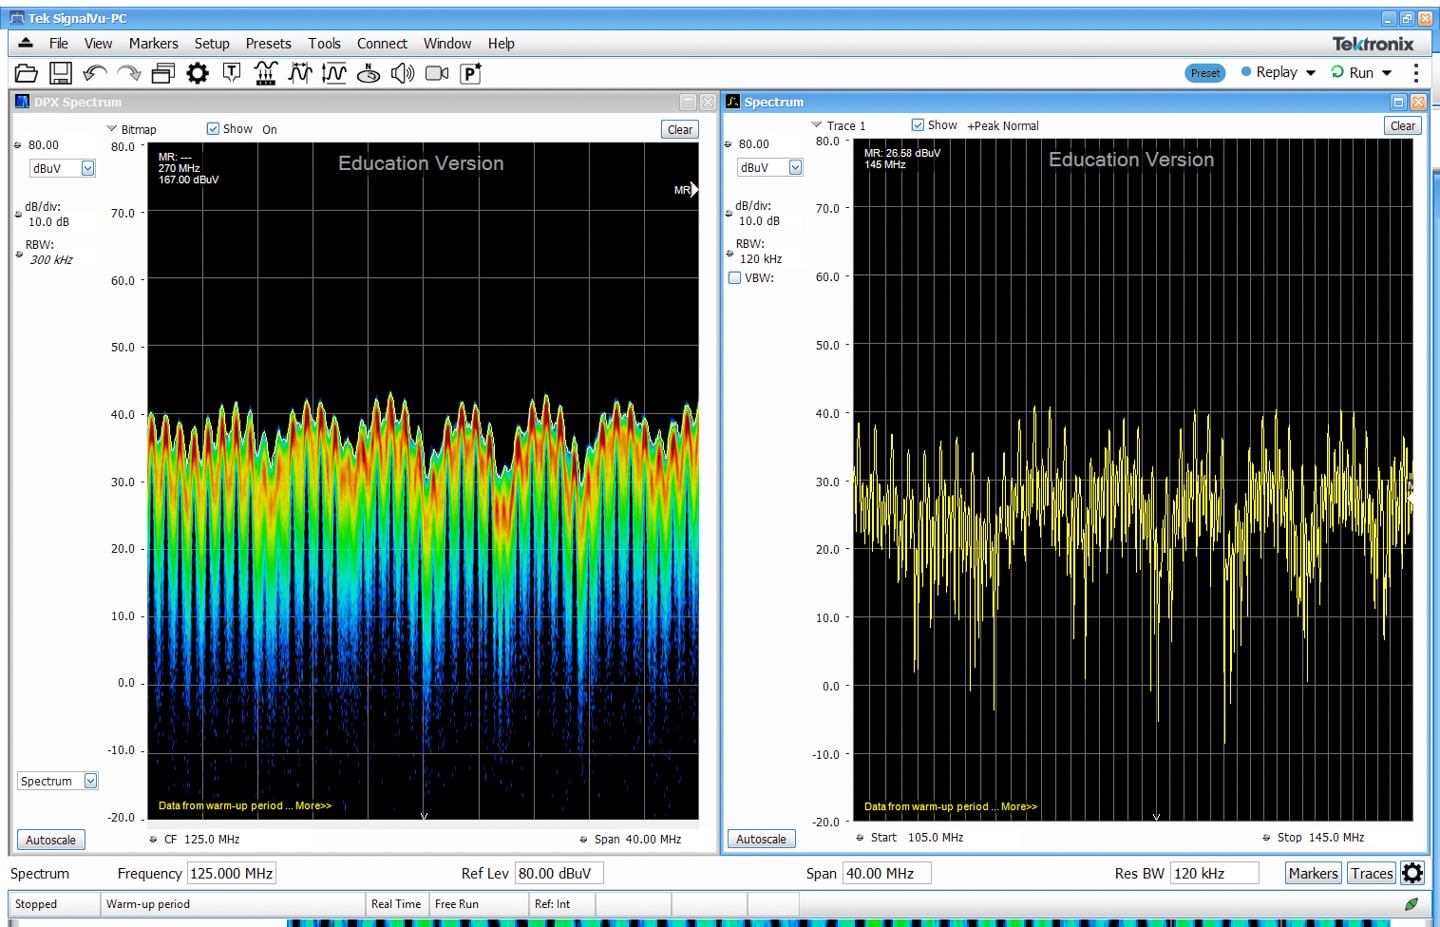
Figure 5 – Without moving the probe, we see “mode 2” from the DC-DC converter, which briefly appeared.
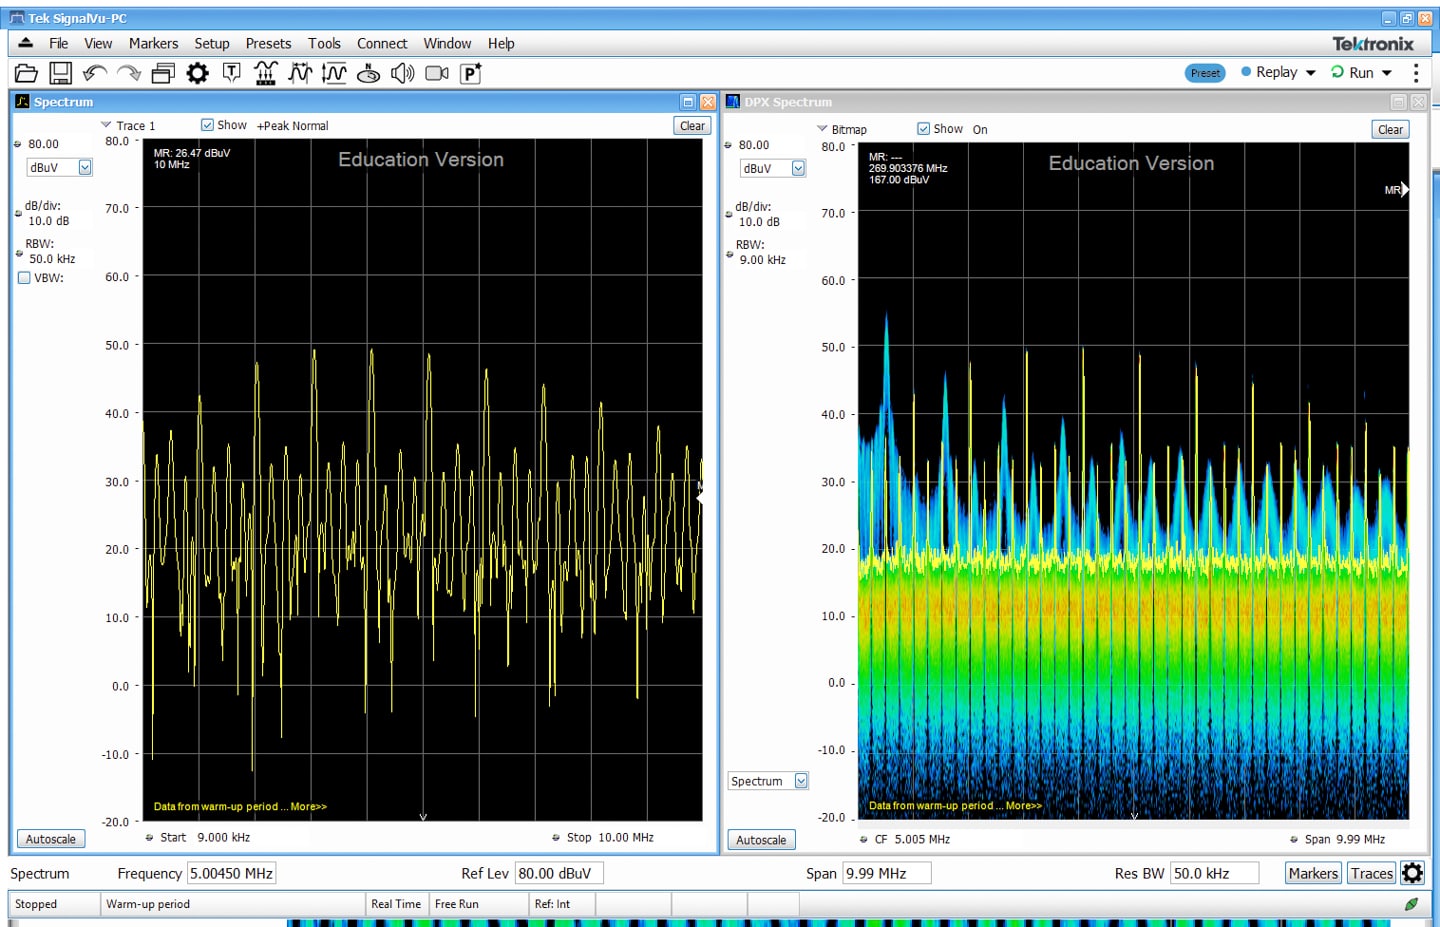
Figure 6 – Again, without moving the probe, we see “mode 3” with much increased narrow band emissions measuring about 10 dB higher than modes 1 and 2. This brief occurrence could have been the mode that would have resulted in a compliance failure, should the emission get coupled out and radiate.
Example 3 – Detection of Spurious Oscillation
In this example, we don’t necessarily need the RT capture, but it does yield some interesting visual clues once we activate the spectrogram (waterfall) display feature.
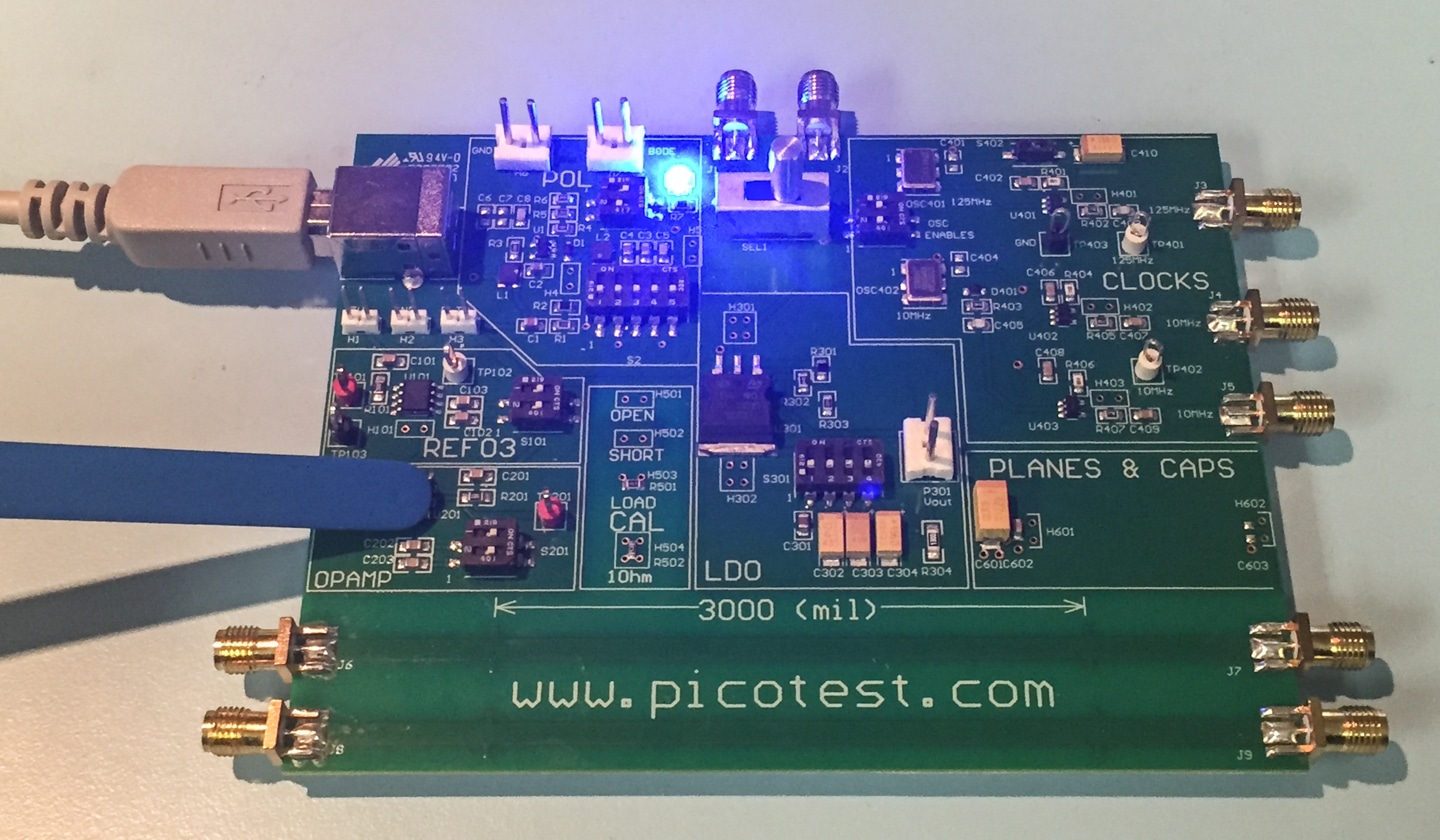
Figure 7 – Measuring an op-amp on the Picotest Technologies demo board.
It turns out that when the op-amp was unloaded capacitively, it produced a very interesting oscillation at near its open loop band-width (Figure 8). Examining the RT measurement on the right, we can see there’s a distinct bimodal (two-frequency) display, along with some cool sideband emissions. The swept display on the left can only capture one of these two frequencies at a time, at best, as the oscillation is switching from one frequency to the other.
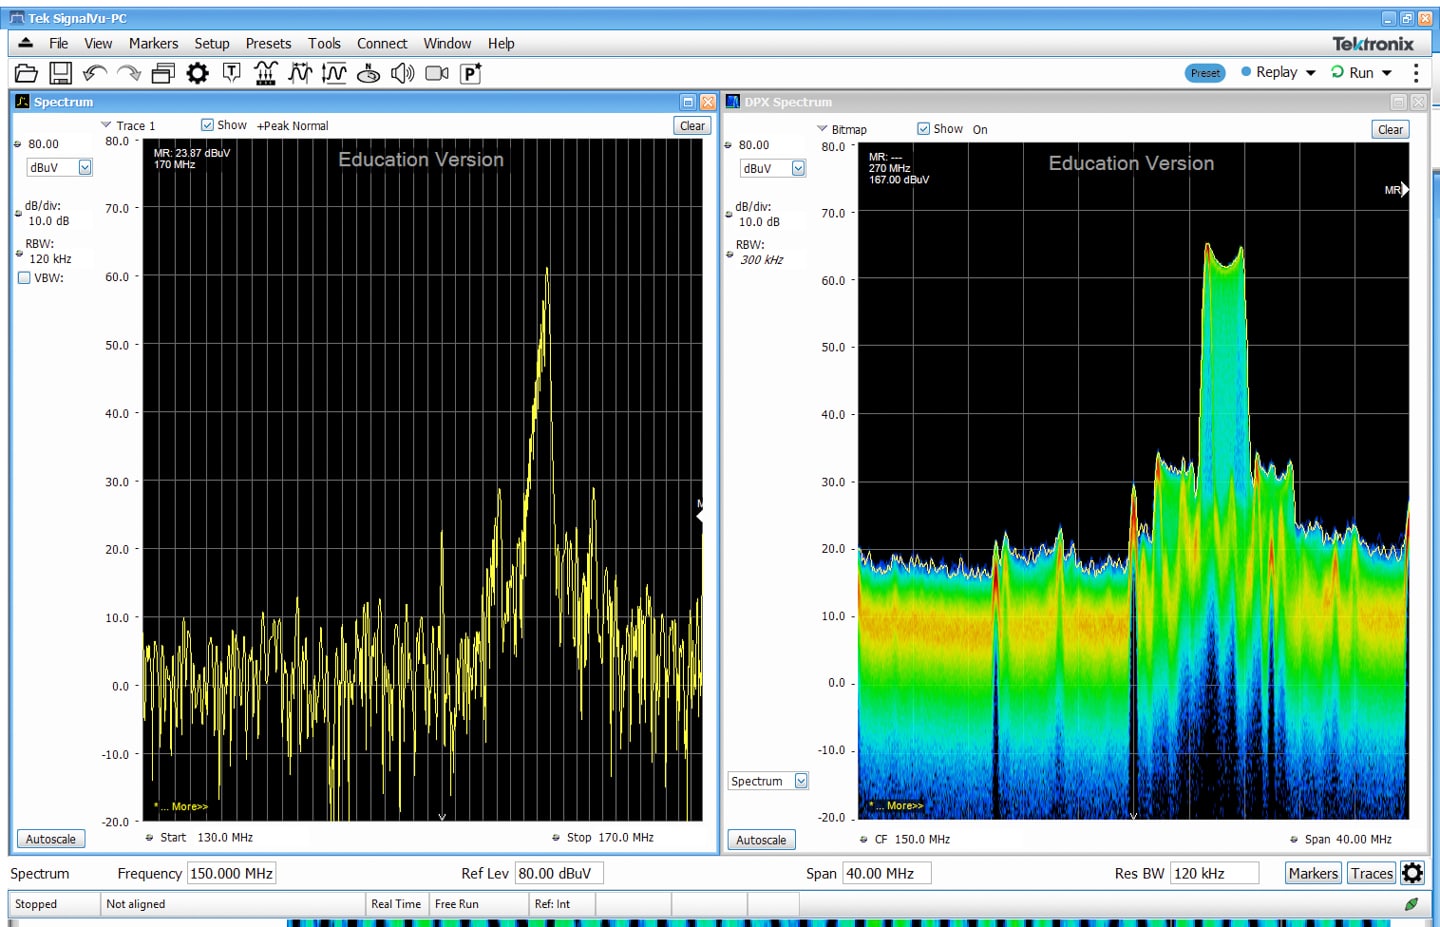
Figure 8 – Measurement of an interesting spurious oscillation of an op-amp. Note that the swept measurement on the left can only capture one of the bimodal states at a time, while the RT capture on the right is very detailed.
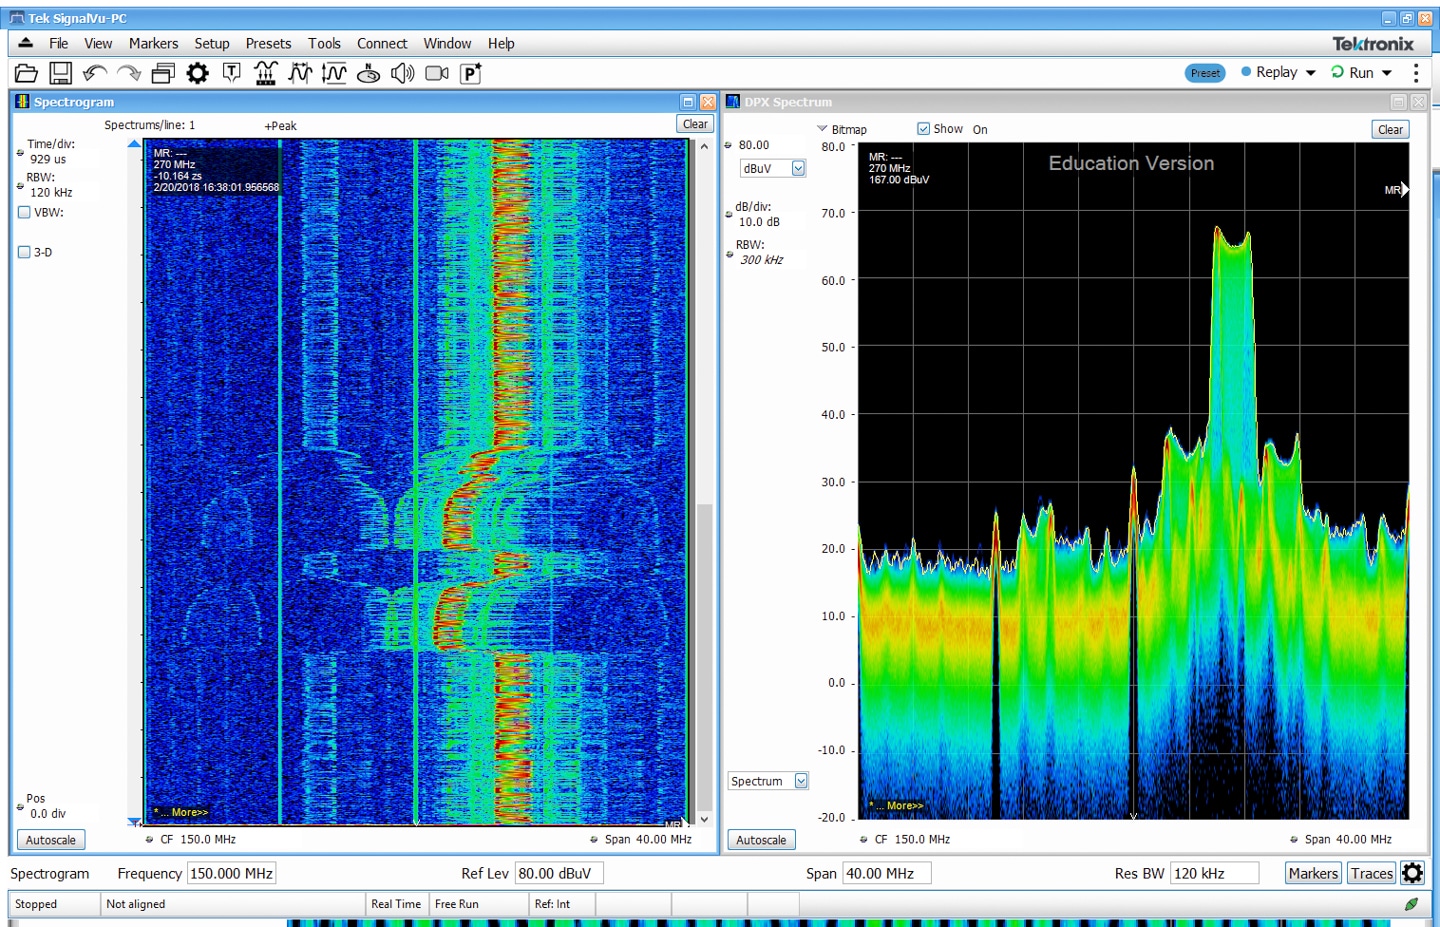
Figure 9 – Replacing the swept display with a spectrogram (frequency versus time), we can observe some interesting details (see text).
But let’s analyze the “bi-modal-ness” a little closer by replacing the swept display with a spectrogram of frequency versus time.
One thing I noticed (and this is very common for spurious oscillations) is that placing my finger on the area of the op-amp changed the parasitic characteristics enough to shift the oscillation frequency quite a bit downward. You can see that shift in the spectrogram display in Figure 9 as I touched my finger to the area twice.
The other thing to note is that you can now easily observe the switching between one oscillation frequency and the other in the “zig zag” pattern in the spectrogram. Note that the oscillation spends more time at the lower frequency, rather than the upper frequency. This is also indicated by the slightly higher amplitude of the left side of the double peak.
CONCLUSION
As technology continues to advance, we EMC engineers and product designers need to upgrade our usual analysis and pre-compliance test tools to stay one step ahead and be able to better capture and display the more unusual emissions expected. Real-time spectrum analyzers have already proven to be invaluable for EMI debug and troubleshooting. Advanced spectral analysis will be especially important as mobile devices continue to shrink and more products incorporate wireless and other advanced digital modes.
REFERENCES
- Tektronix RSA306B spectrum analyzer, https://www.tek.com
- Tekbox Digital Solutions near field probes, https://tekbox.net
- 2017 EMI Pre-Compliance Test Guide, http://learn.interferencetechnology.com/2017-emc-pre-compliance-test-guide/
- Harmonic Analyzer Tool (Patrick André), http://andreconsulting.com/papers.htm


