NOTE: This article has been translated from German to English. It can be found in its original language in the 2014 Europe EMC Guide.
Dipl. Ing. Carsten Stange, LANGER EMV-Technik GmbH
INTRODUCTION
Langer EMV-Technik has been providing services to help eliminate interferences in electronic assemblies for 20 years. We have gained a wealth of experience in measuring high-frequency fields by solving a wide variety of practical problems. This pool of technologies led to the development of a multitude of near-field probes which are very useful during practical work on electronic assemblies.
Near-field probes in EMC permit the localization of sources of electromagnetic interference, even in very confined arrangements. Near-field measurements on switch converters, for example, can thus help determine the frequencies of the greatest electromagnetic interferences of the entire electronic assembly.

These measurements, however, cannot be used in a general physical context since the probe’s output voltage is a function of the field strength. This voltage also depends on the probe’s frequency response and thus is frequency-dependent. These limitations of the measurement technology mean that practical problems can only be solved by comparative measurements.
Knowing the exact field strength and distribution of the interference fields, however, enables development engineers to eliminate EMC problems at an early stage of the development process. Furthermore, comparative measurements are often no longer required if the absolute value can be measured. Last but not least, the developer’s focus automatically shifts to the physical mechanisms of action and problems can thus be remedied more quickly.
How Magnetic Fields are Corrected
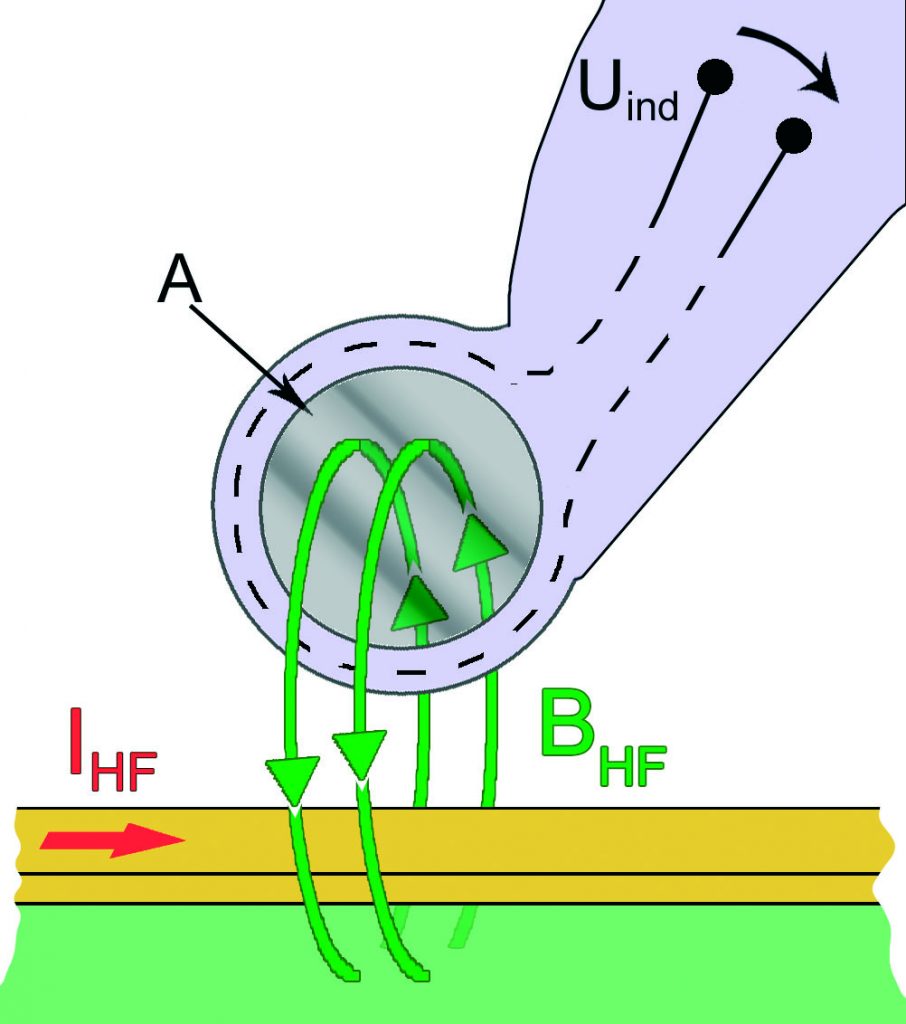
Faraday’s law of induction is the physical mechanism of action on which the near-field probes are based. This law says that a varying magnetic field which passes through a conductor loop induces a voltage in this loop and it is based on the following general mathematical expression:
(1)  This expression can be simplified in a technical context. The left side of the equation can simply be replaced by the voltage in a conductor loop Uinduction and the area integral on the right side by the winding area A.
The voltage induced in the conductor loop now is a measure of how the magnetic flux density changes over time.
(2)  B = magnetic flux density
t = time
A = coil area
N = number of windings
Nevertheless, these simplifications provide no information about the field distribution in the winding. The magnetic flux density is averaged across the entire coil area.
When considering the issue in terms of frequency, the resulting linear function directly demonstrates the relationship between the magnetic field strength and the induced voltage.
(3)
 Measurements in high-frequency technology are generally carried out in 50 Ohm systems. Due to this low load impedance, the probe’s output voltage deviates from the induced voltage. This deviation is described by the probe’s transfer function so that the following generally applies:
(4)
![]() The transfer function is specific for each probe and has to be determined using the measurement technology.
The transfer function is specific for each probe and has to be determined using the measurement technology.
The magnetic field correction factor relates the probe’s output voltage to the magnetic field by which it is caused by definition.
(5)
 Determination of the Correction Curve with the MFA K0.1-30
The new MFA K0.1-30 probe is used as an example in this case. This probe was developed to measure magnetic fields and currents on very small structures, but nevertheless it can be guided by hand. The probe head was specially designed to strongly suppress surrounding fields. Measurements can thus be performed on bus lines at a distance of 0.2 mm up to a frequency of 1 GHz.
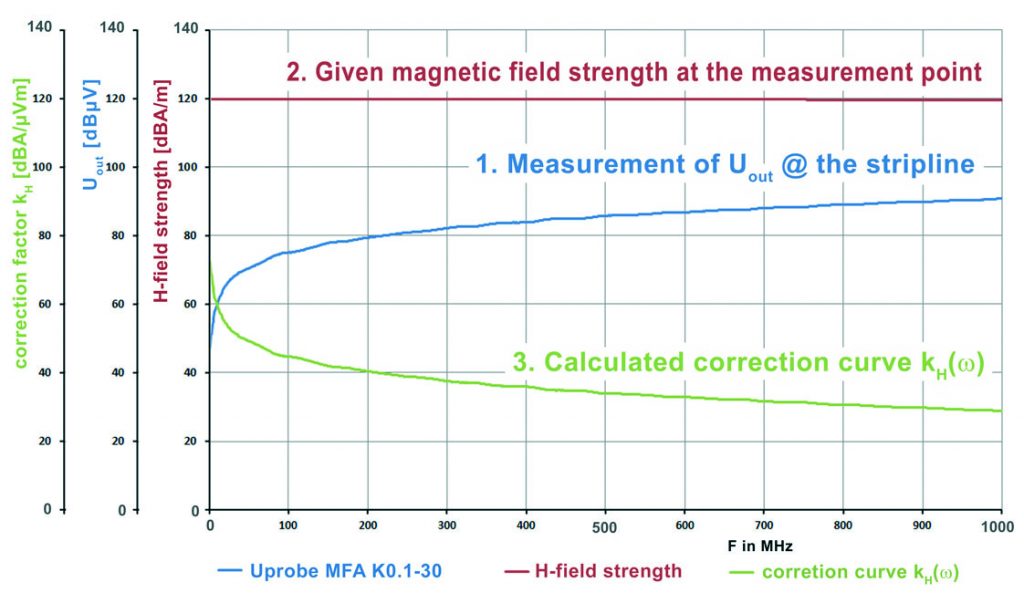
A measurement with the probe on a high-frequency stripline was taken as the starting point for determining the correction curve. A magnetic field which is constant over frequency can be generated on such a line. The probe’s transfer characteristic GSL-probe = Uout / Usource is determined via this field.
The transfer characteristic is then taken as the basis to calculate the probe’s transfer function according to a special mathematical procedure. Equation 5 and the probe’s parameters are then used to determine the respective magnetic field correction curve kH (ω).
The following figure shows how the correction curve is determined in a chart.

Exemplary Measurement of the Magnetic Field Strength
The magnetic field strength in a certain area of an electronic assembly or a signal line is measured in a similar way to how the correction factor is determined. The probe is guided to the respective measurement point and the probe’s output voltage measured. The value and unit of the voltage are then changed using the correction factor. The result of this correction is the value of the magnetic field strength.
The following correlated quantity equation, which is developed by transposing and taking the logarithm of Equation 5, is used to correct the measured values.
(6)
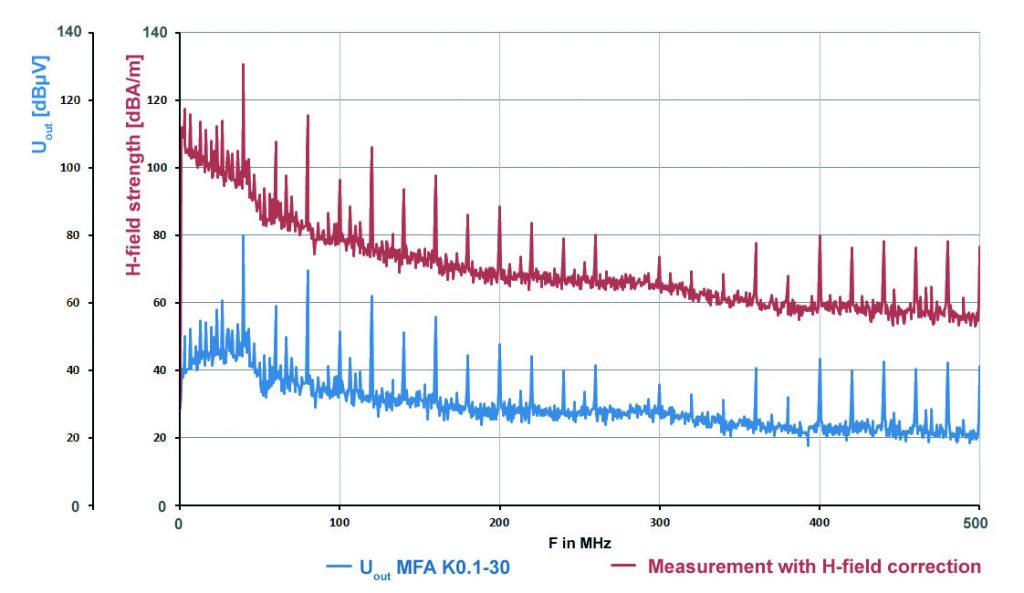
 Figure 3 shows the frequency response (blue) on a circuit’s supply pin. The periodically recurring peaks of the clock frequency at which the circuit is operated are clearly visible. The frequency response (red), however, shows the blue frequency response offset against the correction curve. The values of the magnetic field strength which is caused by the HF current flowing through the supply loop can be read at this frequency response.

On the basis of the field strength values, voltage injections into other loops which exist on the electronic module, for example, can be simply calculated with Equation 3.
Even other correction factors such as the current that flows through the conductor are possible. These factors, however, are only valid if exactly the same measurement set-up is chosen that was used for the correction.


