This article addresses the fundamental concepts underlying the classical shielding theory based on Schelkunoff’s equations [1]. In order to assess the applicability of these equations, an understanding of their origin, assumptions made in their derivations, and their limitations, are needed. This tutorial article addresses each of these points. The goal is not to show the derivations but to explain the process leading to the final Schelkunoff’s equations underlying the accepted shielding theory. The validity of these equations is assessed by performing the magnetic and electric field measurements in the near field of the source. It is shown that the H-field measurements in the near field correlate with the results of the Schelkunoff’s equations. The E-field measurements in the near field, however, do not. Instead, the measurement results of the electric field in the near field of the source adhere to the wave theory developed for the far field. A plausible explanation of this fact is that the shielding theory was developed under the assumption of a point source, which is not the case for practical sources and near field measurements.
Introduction
Shielding theory is based on three fundamental concepts:
- reflection and transmission of electromagnetic waves at the boundaries of two media,
- radiated fields of the electric and magnetic dipole antennas,
- wave impedance of an electromagnetic wave.
The first concept leads to the analytical formulas for the far field shielding effectiveness of a metallic shield in terms of the reflection loss, R, and the absorption loss, A, as functions of frequency, f[2], [3]:
 (1.1a)

(1.1b)
where t represents the thickness of the shield in inches, and μr, and σr, are the relative permeability (with respect to free space) and relative conductivity (with respect to copper), respectively. These formulas hold for both the electric field shielding and the magnetic field shielding, commonly referred to as the electromagnetic field (or wave) shielding.
When combined with the concepts of the fundamental dipole antennas and wave impedance, the far field formulas lead to the expressions for the near field shielding effectiveness.
The absorption loss in the near field is given by the same formula as in the far field, i.e., Eq. (1.1a). The formulas for the reflection loss for the electric field sources and magnetic field sources are different. In the near field, the reflection losses for the electric field sources, Re, and the magnetic field sources, Rm, are specified by
 (1.2a)

(1.2b)
This tutorial article outlines the derivation of Schelkunoff’s equations and tests their validity against the near-field measurements. The paper is organized as follows. Section 1 reviews the reflection and transmission of electromagnetic waves at boundaries between two media. The effect of a metallic shield on the wave transmission is discussed in Section 2. Radiated fields of an electric and magnetic dipoles are described in Section 3. Far field and near field shielding formulas are presented in Section 5 and Section 6, respectively. In Section 7 the measurement setup is shown. In Section 8 the analytical and simulation results are correlated with the near field measurements.
Section 1 – Reflection and Transmission of Electromagnetic Waves at Boundaries
Consider a normal incidence of a uniform plane wave on the boundary between two media, as shown in Fig. 1.1. Each medium is described by three constitutive parameters: μ – permeability, ε – permittivity, and σ – conductivity (note: these are real quantities). It is assumed that each medium is simple i.e., linear, homogeneous, and isotropic).
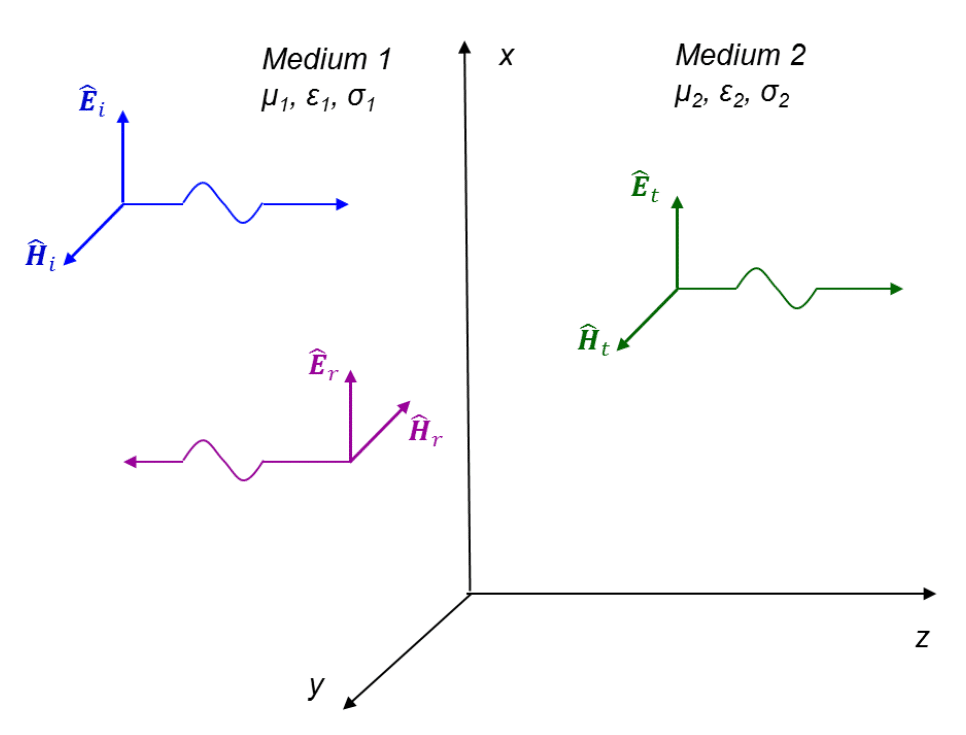 Figure 1.1: Reflection and transmission of a uniform wave at the boundary
When the incident wave encounters the boundary between two media (xy plane), a reflected wave and a transmitted wave are created. Imposing the boundary conditions on the electric and magnetic fields at the interface results in the formulas relating the amplitudes of these waves. These amplitudes are related by the complex intrinsic impedances of each medium. The intrinsic impedances are related to the constitutive parameters of the medium and are given by (note: a “hat” above a variable denotes a complex quantity), [3]:
 (1.3a)

(1.3b)
The amplitude of the reflected wave is related to the incident-wave amplitude by [4]:
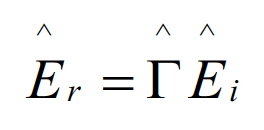 (1.4a)
where is the reflection coefficient at the boundary, and Ѓ is given by
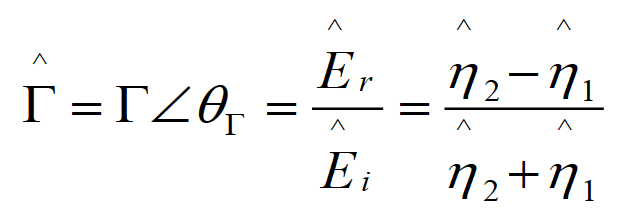 (1.4b)
The amplitude of the transmitted wave is related to the incident-wave amplitude by
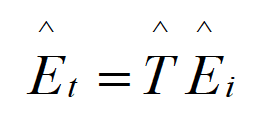 (1.5a)
where is the transmission coefficient at the boundary, and Ѓ is given by
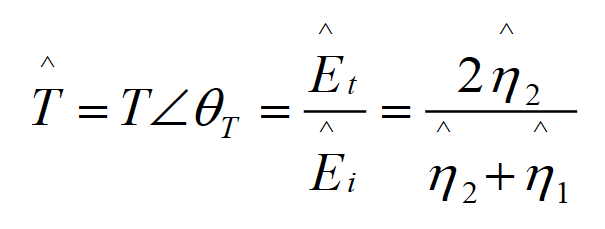 (1.5b)
Now, consider a metallic shield in the far field of the source; the shield has thickness t and surrounded on both sides by air (free space), as shown in Fig. 1.2.
The free-space regions are described by the phase constant, b0, and intrinsic impedance, h0, given by
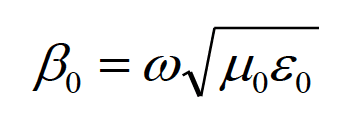 (1.6a)
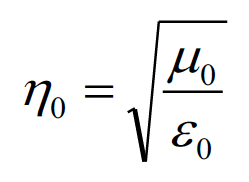 (1.6b)
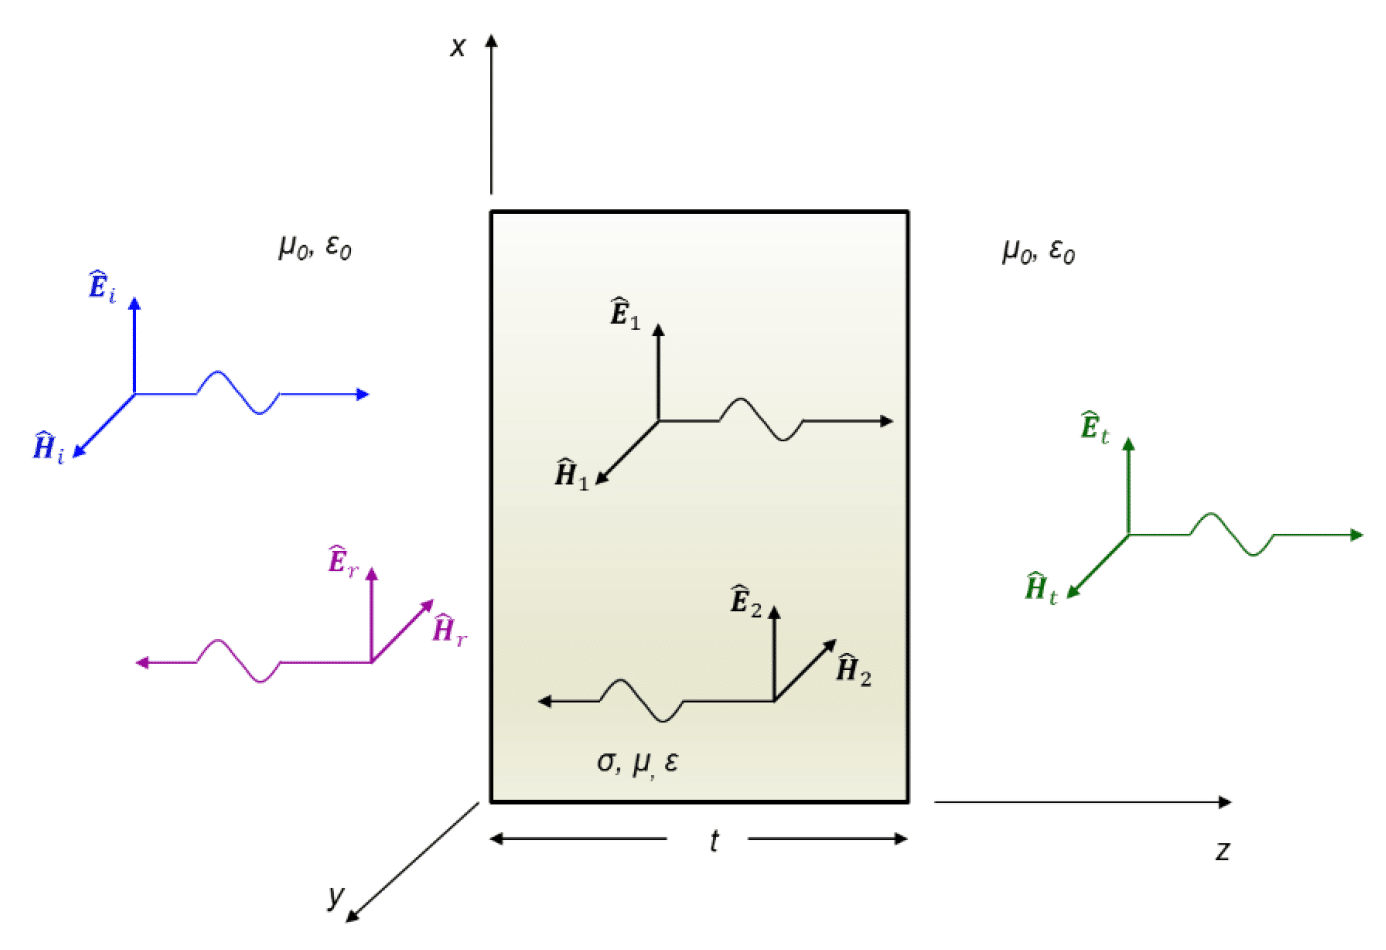 Figure 1.2: Electromagnetic wave impinging on a shield
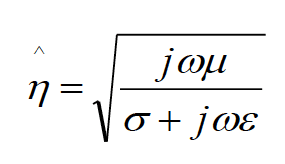
The shield is described by the propagation constant, g, and the intrinsic impedance, h, given by
 (1.7a)
 (1.7b)
Upon the arrival at the shield, the uniform plane wave, (Ei,Hi) is partially reflected, (Er,Hr), and partially transmitted, (E1,H1), through the shield. The portion of the incident field that is reflected at the shield interface will be described (in Section 3) by the reflection loss, R.
The portion of the wave that crosses the shield surface is attenuated as it travels through the shield will be described (in Section 3) by the absorption loss, A. The transmitted wave, (E1,H1), upon arrival at the rightmost boundary will be partially reflected, (E2,H2), and partially transmitted, (Et,Ht) through the shield.
The reflected wave, (E2,H2), propagates back through the shield towards the first interface, incident from the right. Once again, a portion of this wave is transmitted through the left interface and a portion is reflected and travels to the right. This process continues, but the additional reflected and transmitted waves are progressively attenuated. The portion of the wave that undergoes multiple reflections within the shield will be described (in Section 5) by the multiple reflection loss, M.
Section 2 – Electric and Magnetic Field Transmission through the Shield Boundaries
It is very instructive to analyze the effect of the shield on the electric and magnetic fields at the left and right boundaries. The results shown in this section are normally derived under the following assumptions: the shield is thick, made of a good conductor, and located in the far field of the source. The far field assumption translates into the fact the E field impinging onto the shield is perpendicular to the shield. Thus, it is reasonable to argue that the far field results should apply in the near field, as long as the impinging E field is perpendicular to the shield. It is conceivable, therefore, to postulate that some of the electric field lines emanating from practical sources (not point sources) are indeed perpendicular to the surface of the source and thus perpendicular to the shield in the near field. Consequently, to some extent, the far field results should be applicable in the near field. This is indeed the case as we will show in the measurement section.
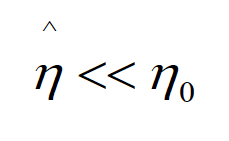
The space free regions on either side of the shield have the intrinsic impedance specified by Eq. (1.6b) and the shield has the intrinsic impedance given by Eq. (1.7b). The assumption of a good conductor results in the following inequality
 (2.1)
(2.1)
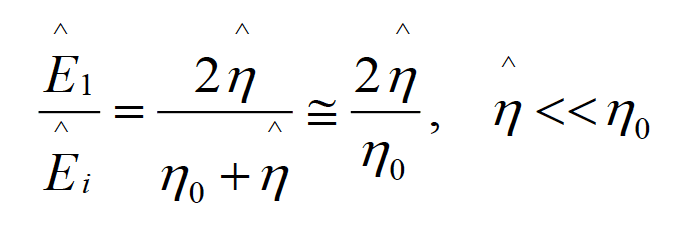
This inequality has a very important and revealing impact on the magnitudes of the transmitted fields at the shield boundaries. Let’s look at the electric field first. At the left boundary the transmission coefficient is [3]
 (2.2)
(2.2)
Thus, the electric field transmission coefficient is very small at the first boundary. This means that very little of the electric field is transmitted through the first boundary; that is, almost all of the incident electric field is reflected.
This is a very important observation! The consequence of this fact is that (as long as the shield is made of a good conductor) a metallic shield will almost entirely reflect the impinging electric field, regardless of the shield thickness. We will confirm this observation in the measurement section.
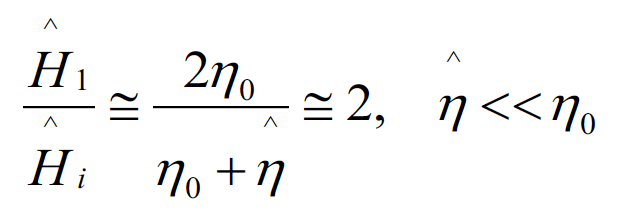
Now, let’s look at the magnetic field transmission. At the left boundary the transmission coefficient is
 (2.3)
(2.3)
Thus, at the first boundary the transmitted magnetic field doubles. This, again is a very important observation. The consequence of it is that we need thick shields to attenuate magnetic fields, and thus the shield thickness matters. We will confirm this observation in the measurement section.
Section 3 – Radiated Fields of the Electric and Magnetic Dipole Antennas
Electric (or Hertzian) dipole, shown in Fig. 3.1, is modeled as a very short current element of length l, carrying a constant current I0. The current element is positioned symmetrically at the origin of the coordinate system and oriented along the z axis.
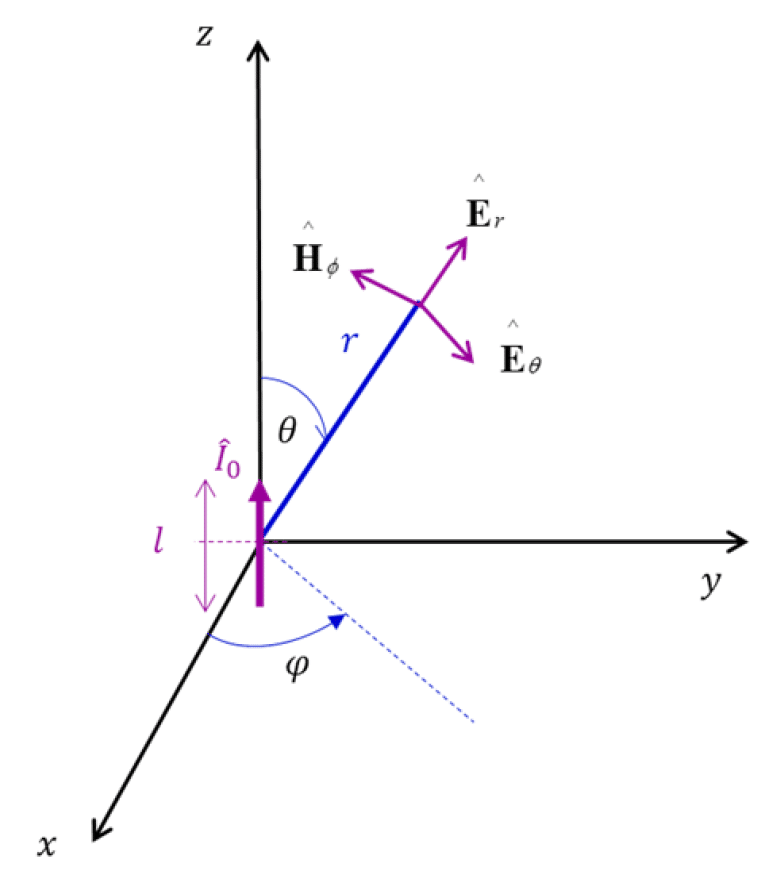 Figure 3.1: Electric (Hertzian) dipole antenna
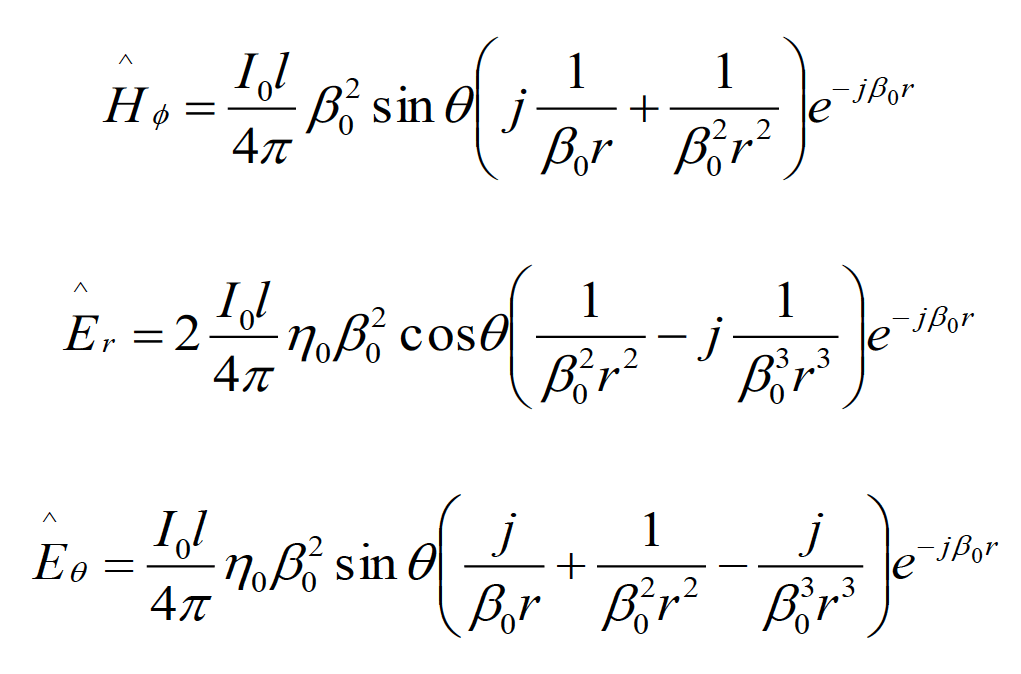
Electric-dipole total radiated fields are given by [3], [4]:
 (3.1a)(3.1b)(3.1c)
Magnetic dipole, shown in Fig. 3.2, is modeled as a very small loop of radius a, carrying a constant current I0. The loop is positioned symmetrically in the xy plane with its center at the origin of the coordinate system.
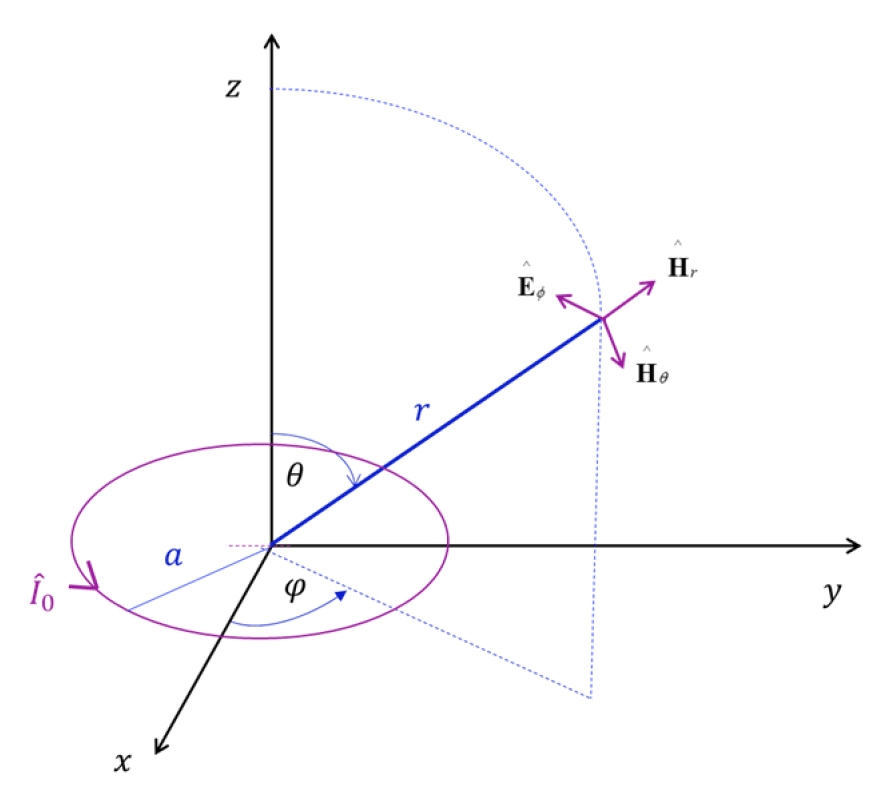 Figure 3.2: Magnetic dipole antenna
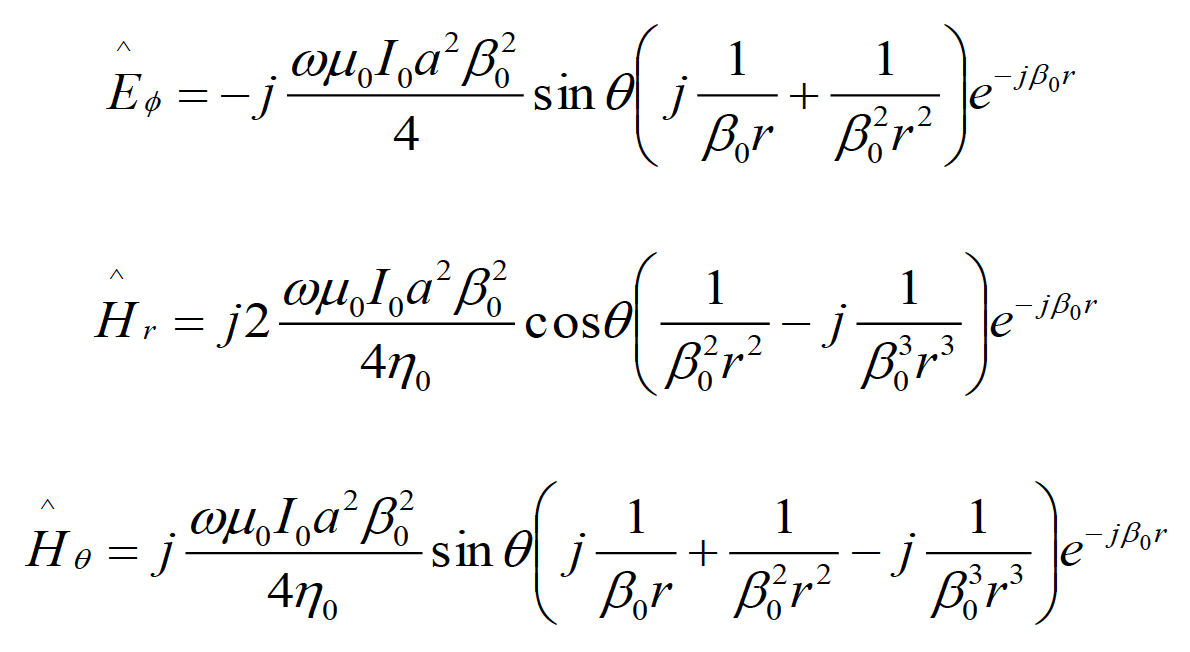
Magnetic-dipole radiated fields are given by [3]:
 (3.2a)(3.2b)(3.2c)
It is interesting to note the duality between the field expressions for both dipole antennas. We will use the above expressions for the total radiated fields in the next section, when introducing the concept of the wave impedance.
In many practical applications it is often useful to focus on the near field- and far field radiated fields (instead of the total radiated fields). In the near field, we have
 (3.3a)
while in the far field, the opposite inequality holds
 (3.3b)
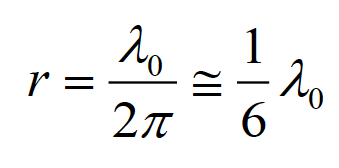
The boundary between the near and far fields is when
 (3.4)
(3.4)
or
 (3.5)
(3.5)
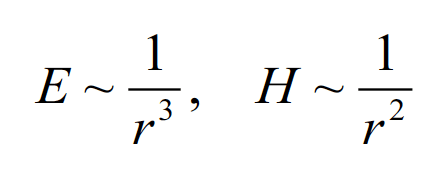
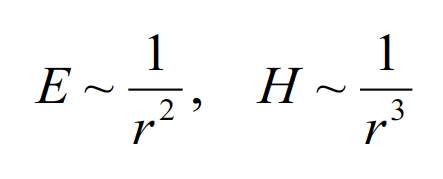
We will refer to this important result in the next section (in Fig. 4.1). Utilizing the inequalities (3.3) in the equations for the total radiated fields of the electric and magnetic dipoles leads to the following observations.
In the near field of the electric dipole the magnitudes of the fields are primarily influenced as
 (3.5a)
while in the near field of the magnetic dipole the magnitudes are dominated by the mirror expressions
 (3.5b)
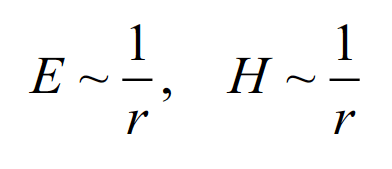
In the far field, of both the electronic and magnetic dipoles we have
 (3.6)
(3.6)
Section 4 – Wave Impedance
The concept of the wave impedance, when combined with the expressions for the radiated fields in the previous section, leads to the shielding effectiveness formulas.
The electric dipole wave impedance is defined as
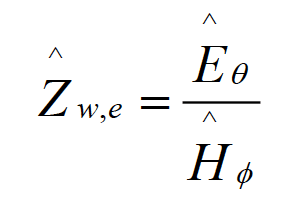 (4.1a)
where, Eq and Hf are given by Eqs. (3.1c) and (3.1a), respectively. The magnetic dipole wave impedance is defined by the dual expression as
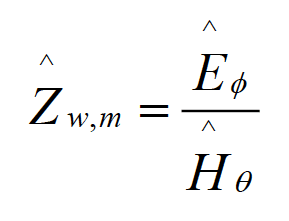 (4.1b)
where, Ef and Hq are given by Eqs. (3.2a) and (3.2c), respectively.
Utilizing Eqs. (3.1) and (3.2) in Eqs. (4.1) leads to the following expressions for the wave impedances. For the electric dipole we have
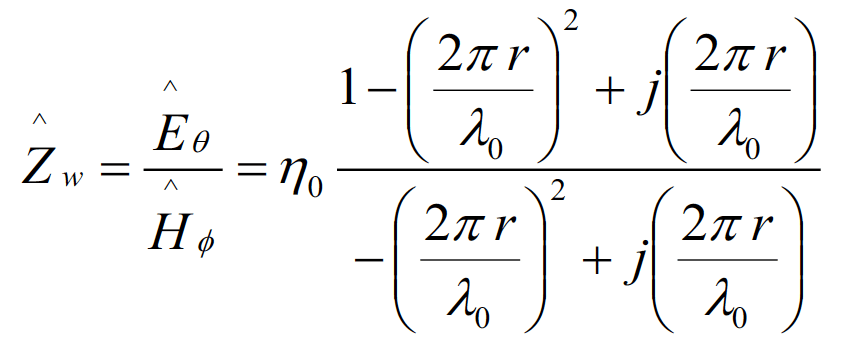 (4.2a)
while for the magnetic dipole we obtain
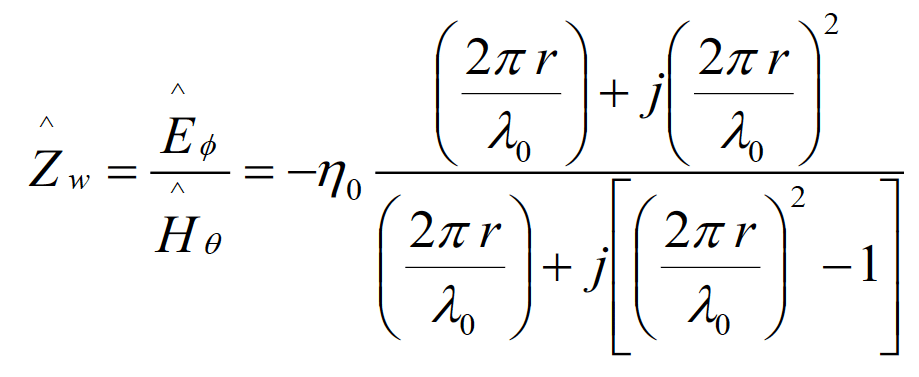 (4.2b)
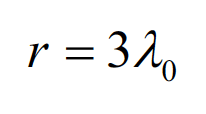
When the expressions in Eq. (4.2) are evaluated at a distance
 (4.3)
(4.3)
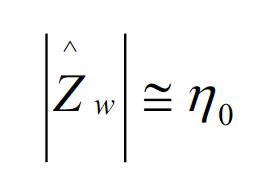
the result for the magnitude of the wave impedance for both the electric and magnetic field is [3], [4]
 (4.4)
(4.4)
This is why, for the these types of antennas, the far field begins at a distance r = l0.
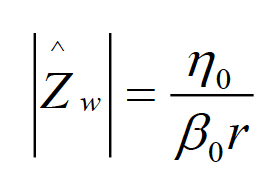
Substituting Eqs. (3.1c) and (3.1a) into Eq. (4.1a) and evaluating it in the near field of an electric dipole gives the wave-impedance magnitude as
 (4.5)
(4.5)
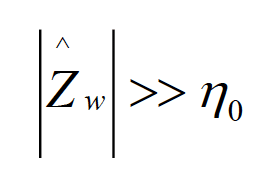
We will use this important result when discussing near-field shielding in the next section. Note that in the very near field, where, b0r≪ 1, the magnitude of the electric dipole wave impedance is much greater than the intrinsic impedance of free space, i.e.,
 (4.6)
(4.6)
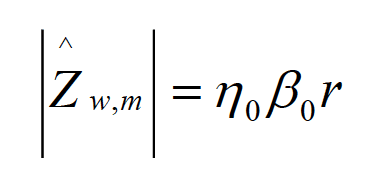
This is why, the electric dipole is often referred to as a high-impedance source. Substituting Eqs. (3.2a) and (3.2c) into Eq. (4.1b) and evaluating it in the near field of a magnetic dipole gives the wave-impedance magnitude as
 (4.7)
(4.7)
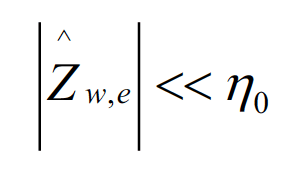
This important result will be used in the next section. Note that in the very near field, where, b0r≪ 1, the magnitude of the magnetic dipole wave impedance is much smaller than the intrinsic impedance of free space, i.e.,
 (4.8)
(4.8)
This is why, the magnetic dipole is often referred to as a low-impedance source. The results of this section are often shown in the well-known summary, shown in Fig. 4.1.
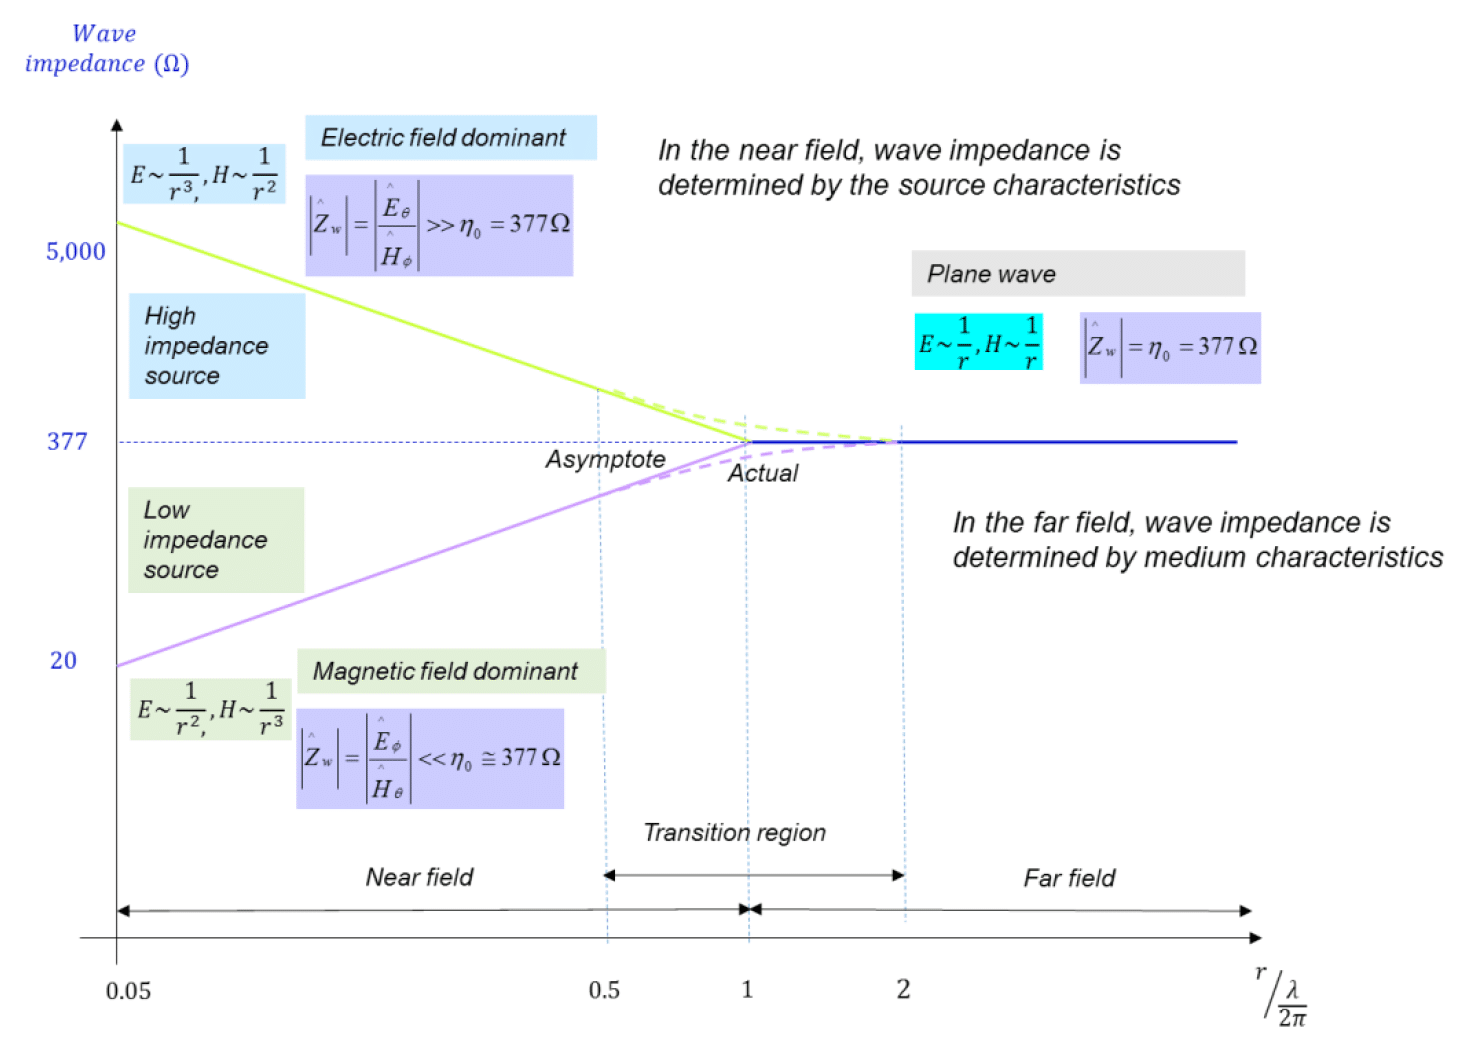 Figure 4.1: Wave impedance as a function of the distance from the source
Section 5 – Far-Field Shielding
The effectiveness of the shield, SE, can be viewed as the ratio of the transmitted-field amplitude to the incident-field amplitude. This ratio is obtained by applying the boundary conditions on the electric and magnetic fields at both the left and the right boundaries of the shield. If a shield has a thickness that is much greater than the skin depth, δ, at the frequency of the incident wave, this ratio is, [3]
 (5.1)
(5.1)
Expressed in dB, the magnitude of the shielding effectiveness, SEdB, becomes
 (5.2)
(5.2)
or, concisely, in terms of the reflection, absorption, and multiple reflection losses:
 (5.3)
(5.3)
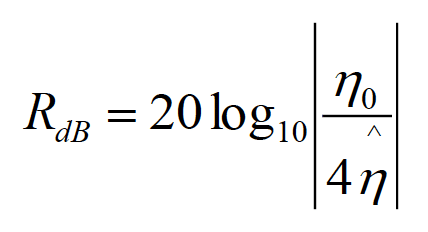
It is very important to point out that this solution was obtained under the assumption of a uniform plane wave, i.e., when the shield is in the far field of the source. Since, in the far field, the magnitudes of the electric and magnetic fields are related by a constant, the shielding effectiveness for the magnetic field is exactly the same as the one for the electric field (unlike the case of the near-field shielding). The result shown in Eq. (5.2) greatly simplifies under the assumption of a thick shield made up of a good conductor. The multiple reflection loss can be ignored and the reflection and absorption losses become, [3]
 (5.4a)
 (5.4b)
Thus, a reasonable, far-field approximation for the shielding effectiveness of a thick, good conductor is
 (5.5)
(5.5)
with the reflection and absorption losses given by Eqs. (5.4). The reflection loss in Eq. (5.4a) can be equivalently expressed as, [2]
 (5.6)
(5.6)
Evaluating the logarithm in Eq. (5.4b) and expressing the thickness in inches, the absorption loss can be equivalently expressed as
 (5.7)
(5.7)
Section 6 – Near-Field Shielding
The distinction between electric and magnetic field sources allows us to use the results of the previous section and the far field shielding to obtain the approximate formulas for the near field shielding.
Recall Eq. (5.4a), repeated here, for the reflection loss in the far field
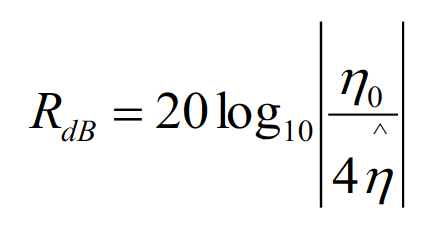 (6.1)
(6.1)
The reflection loss for the near-field electric sources is obtained by substituting the wave impedance from Eq. (4.5)for the intrinsic impedance of free space in Eq. (6.1). The result is [2], [3]
 (6.2)
(6.2)
The reflection loss for the near-field magnetic sources is obtained by substituting the wave impedance from Eq. (4.7) for the intrinsic impedance of free space in Eq. (6.1).The result is
 (6.3)
(6.3)
The absorption loss in the near field is given by the same expression as that in the far field, i.e.,
 (6.4a)
or
 (6.4b)
with the shield thickness, t, specified in inches. As was the case in the far field, the total shielding effectiveness in the near field is the sum of the reflection and absorption losses
 (6.5)
(6.5)
Section 7 – Near-Field Shielding – Measurement Set Up
To verify the theoretical results in the near field we used two different circuits as electric and magnetic field sources and utilized four different solid shields, described in Table 7.1.
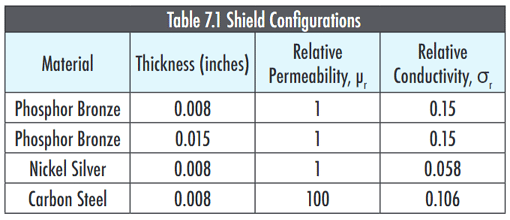 (Table 7.1)
The magnetic field source was a 9V to 5V step-down SMPS operating at a frequency of 125 kHz Measurements were taken from 100 kHz to 20 MHz with a near-field magnetic probe. The measurement setup and the circuit block diagram are shown in Fig. 7.1.
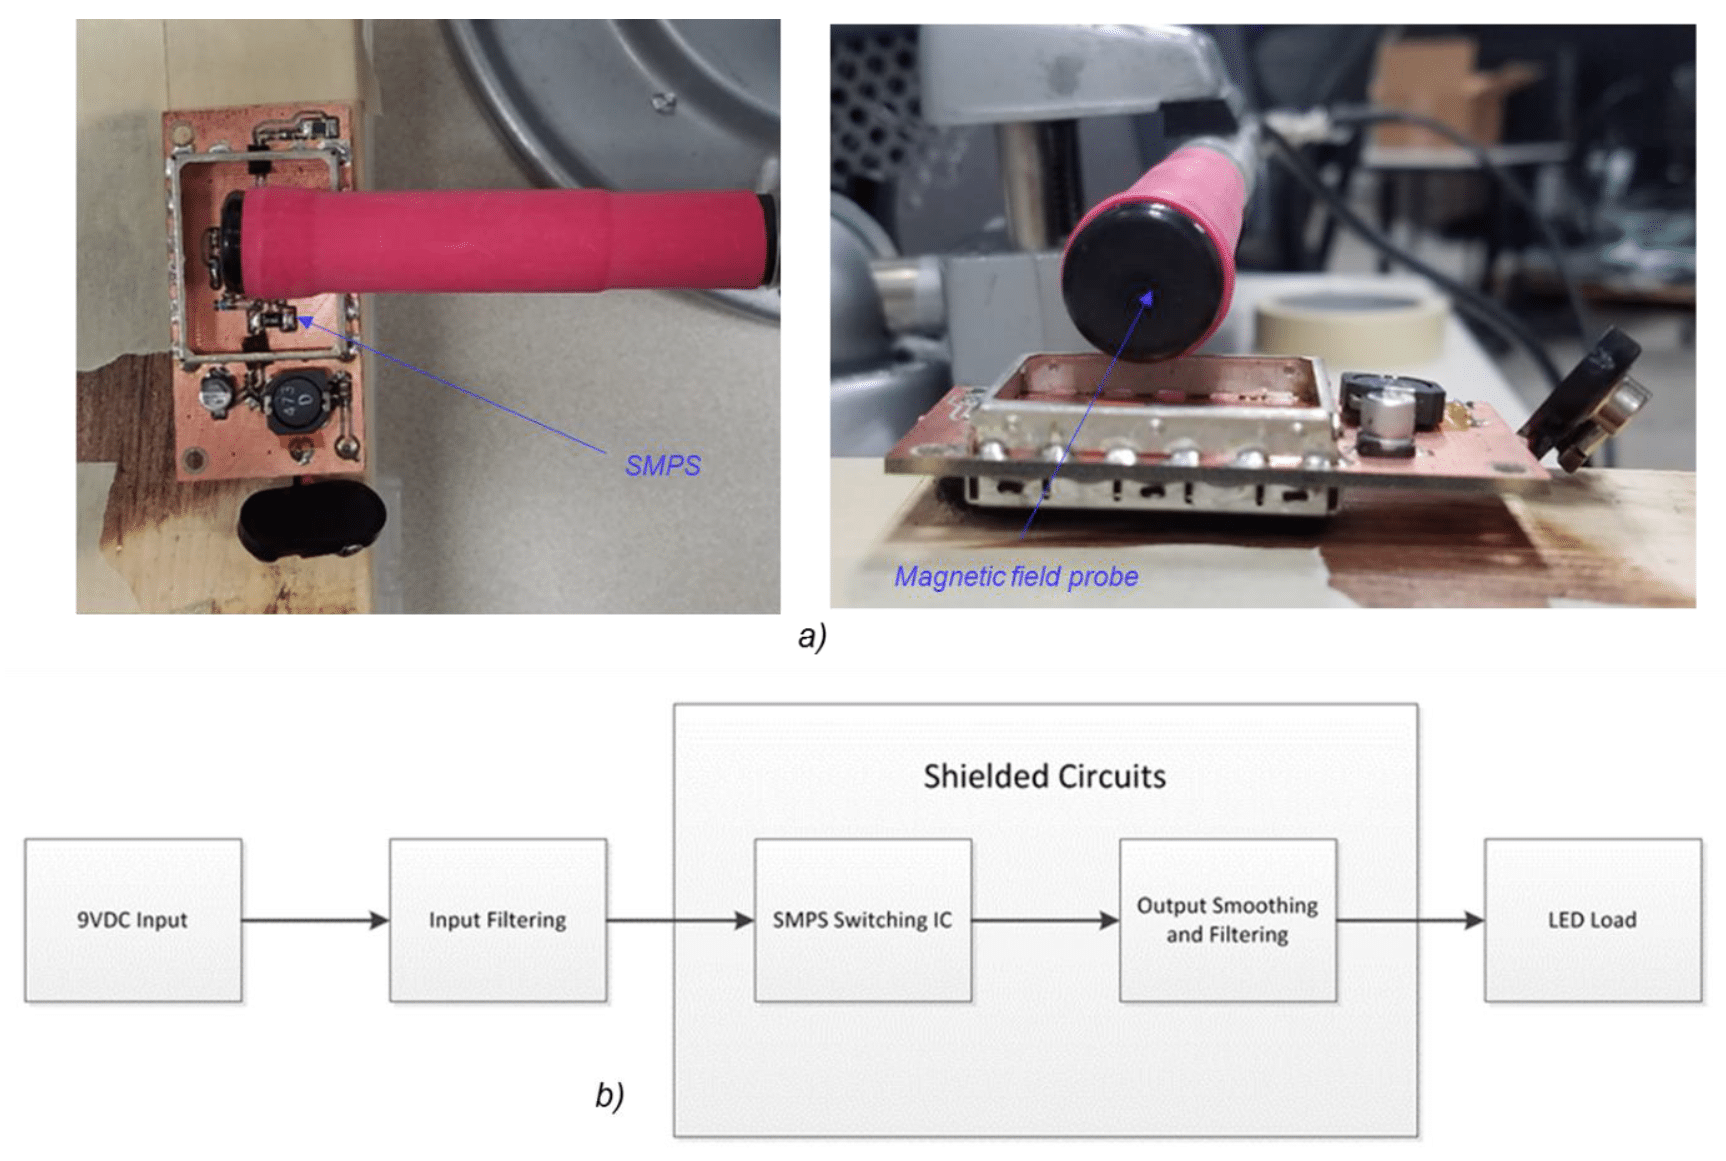 Figure 7.1: Magnetic source circuit – a) measurement setup, b) block diagram
The electric field was generated by a simple 1 MHz crystal oscillator. The crystal output was a 5V logic level signal into a 300 ohm resistor. Measurements were taken from 1 MHz to 900 MHz with a near-field electric probe. The measurement setup and the circuit block diagram are shown in Fig. 7.2.
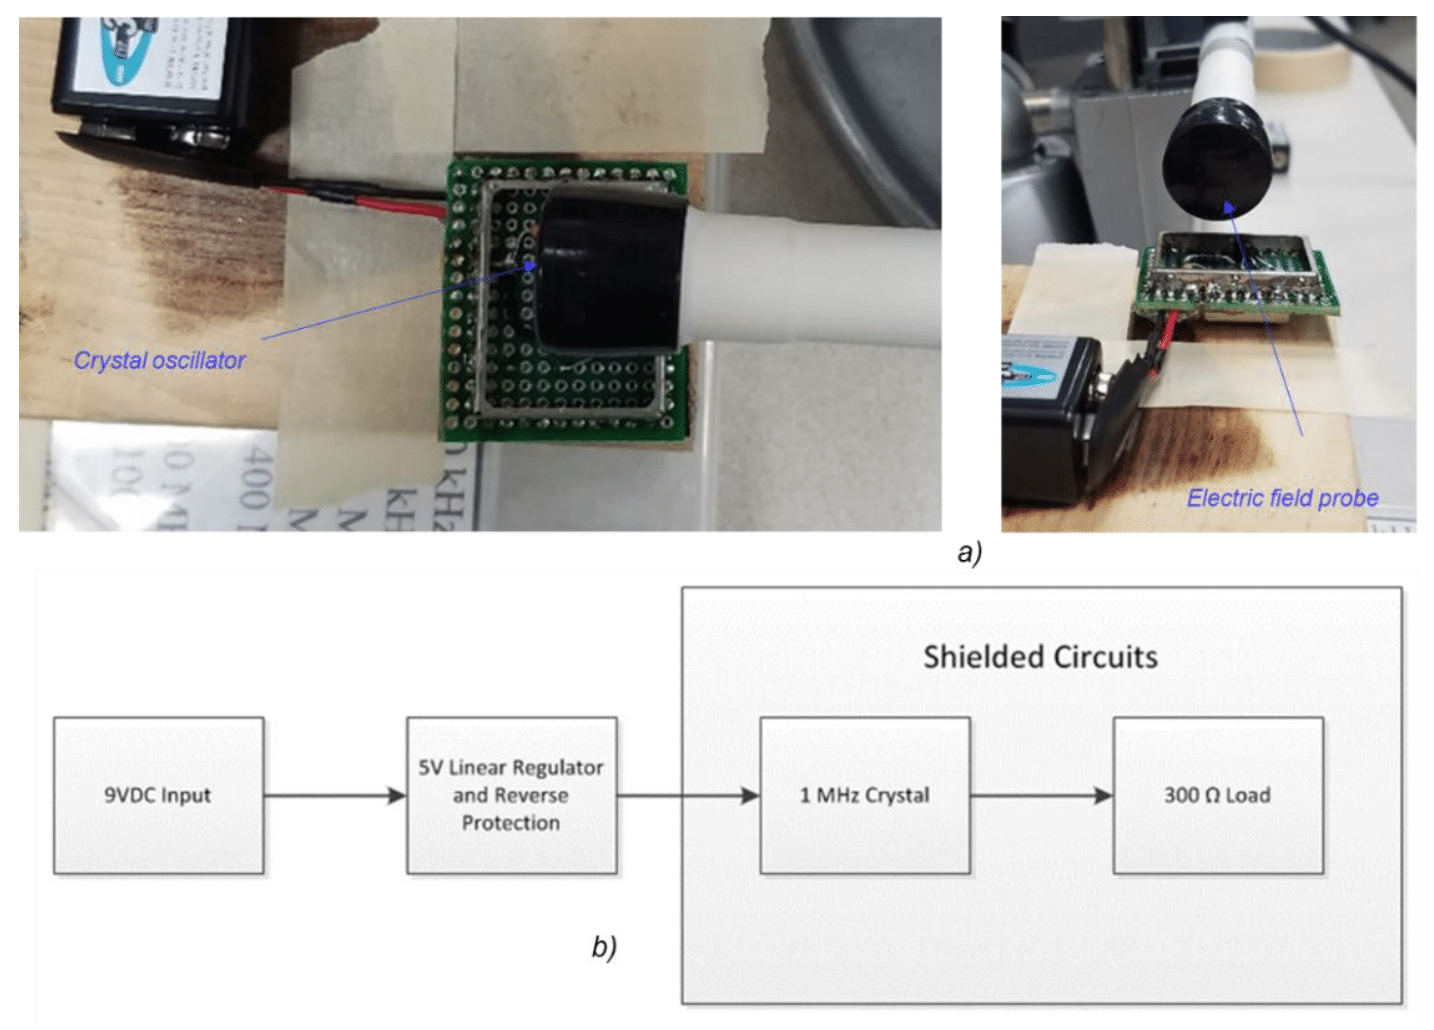 Figure 7.2: Electric source circuit – a) measurement setup, b) block diagram
Several measurements were taken for each source: a baseline with no shield present, and sweeps with each of the four different shield configurations.
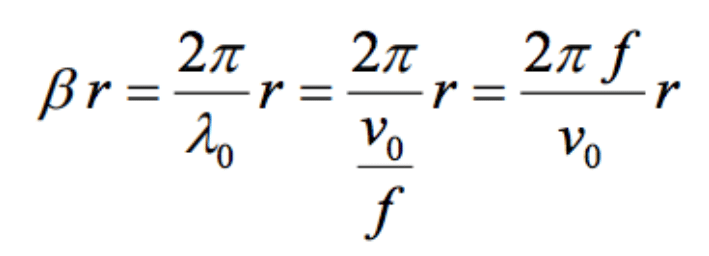
In both measurement setups, the shield was at a distance of 5 mm from the source. To determine whether this distance could be considered as corresponding to the near-field, the expression in Eq. (3.3a) was examined as follows.
 (7.1)
(7.1)
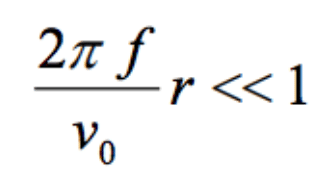
In the very near field we have, 훽훽 훽 1,or
 (7.2)
(7.2)
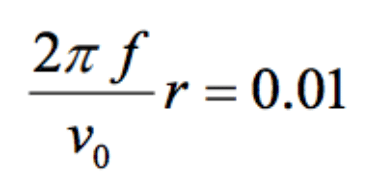
If we assume two orders of magnitude relationship in the above inequality, then we have
 (7.3)
(7.3)
From Eq. (7.4) we can determine the highest frequency up to which the physical distance of 5 mm corresponds to the point in the very near field.
 (7.4)
(7.4)
This result means that up to the frequency of 100 MHz it is reasonable to assume that the shield is in the very near field of the source.
Section 8 – Near-Field Shielding – Simulation and Measurement Results
Phosphor Bronze – 8 mil vs. 15 mil thick
The simulated results for the magnetic field shielding (based on Eqs. (6.3 – 6.5) for the reflection loss, the absorption and the total loss are shown in Fig. 8.1.
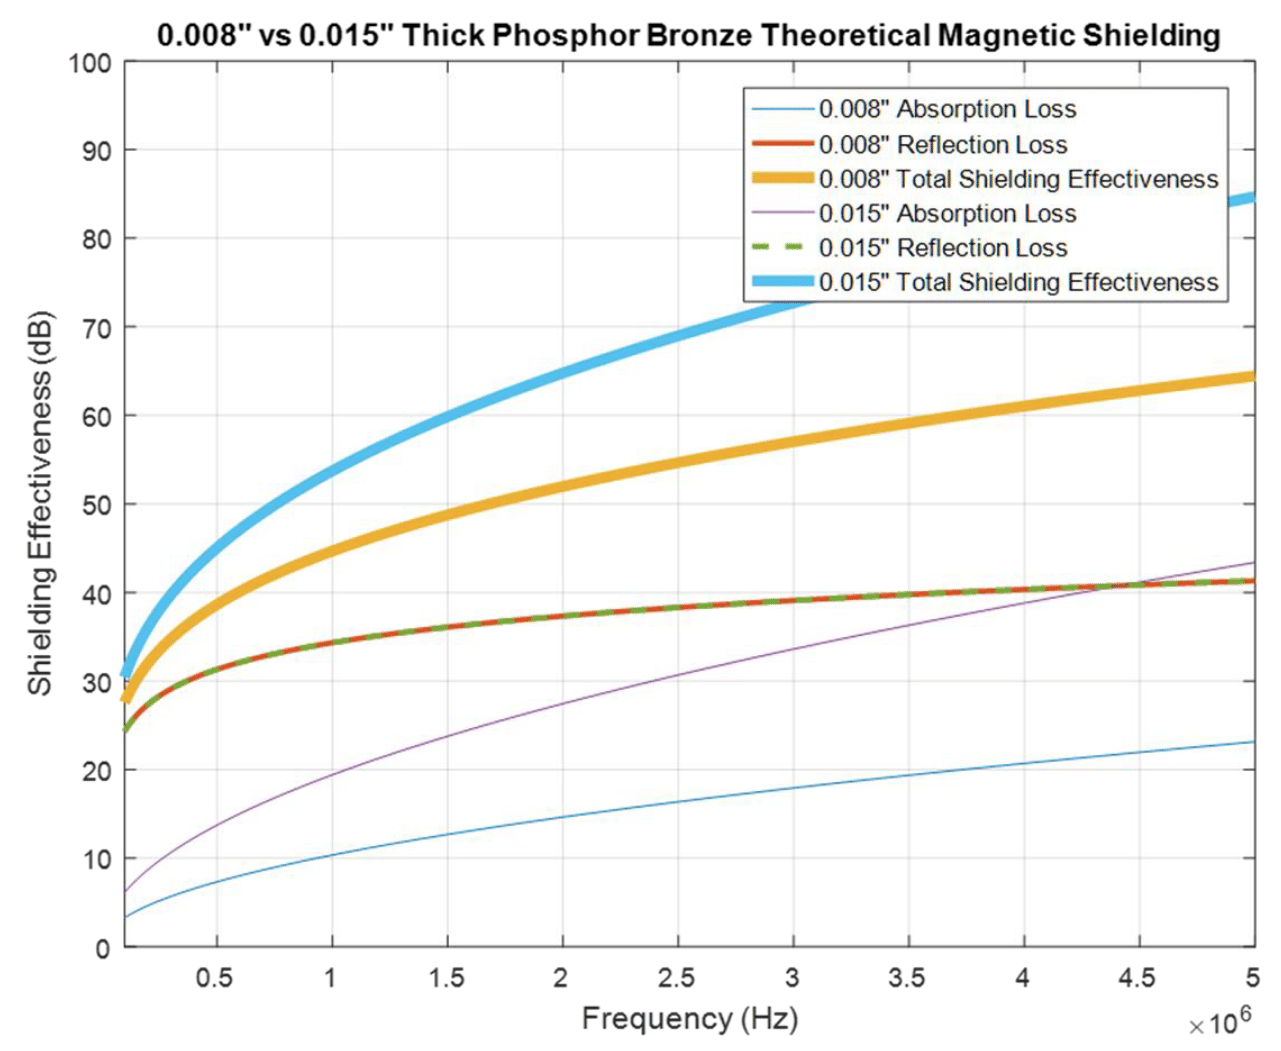 Figure 8.1: Phosphor bronze – 8 vs.15 mils: absorption, reflection, and total magnetic field loss
The reflection loss is the same for both shields but the absorption loss is larger for the thicker shield. Thus, the total shielding effectiveness of the 15-mil thick shield is larger than that of the 8-mil thick shield. The magnetic field measurement results for the two shields are shown in Fig. 8.2
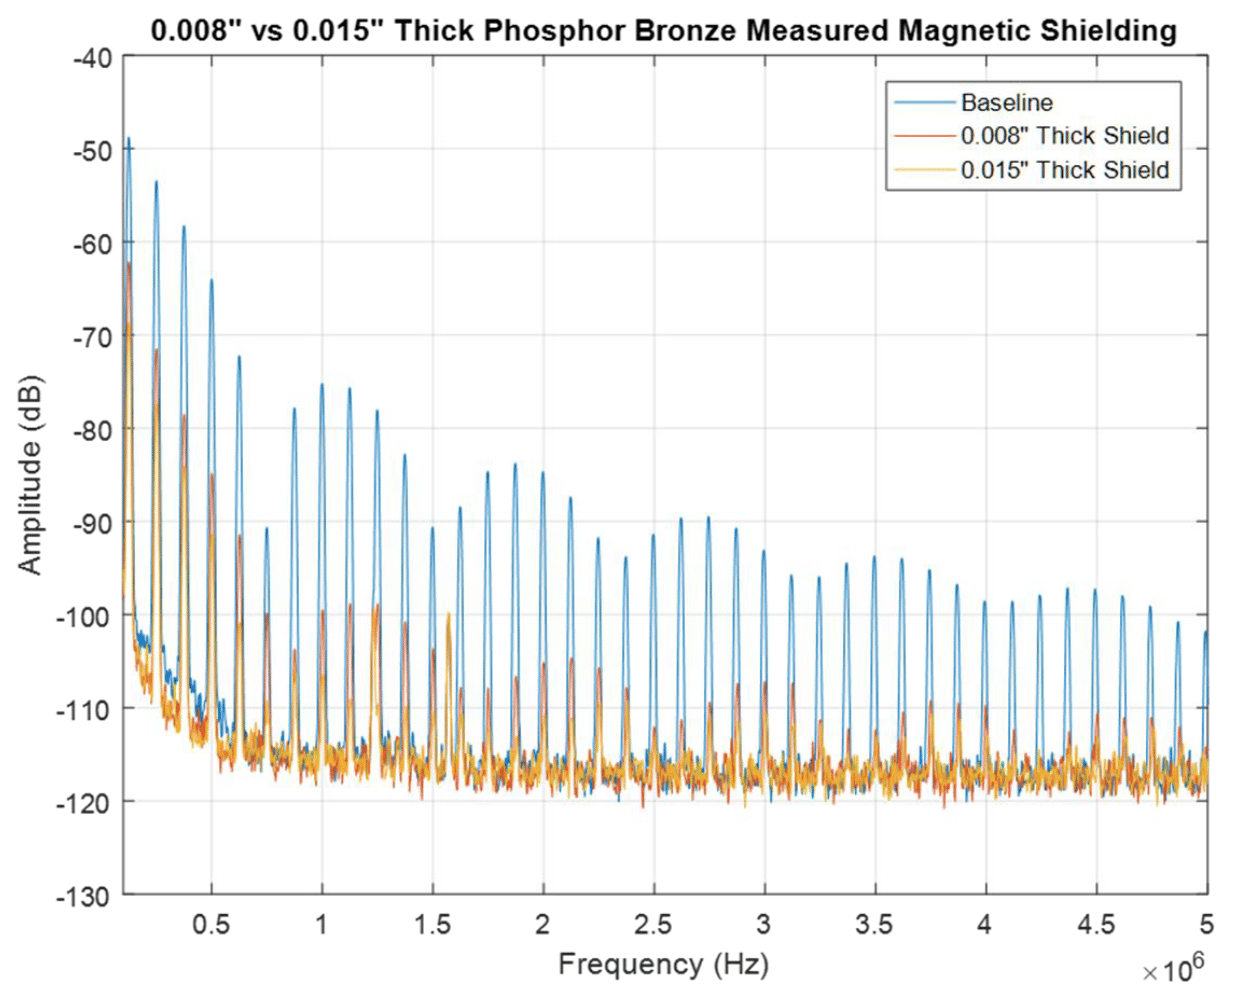 Figure 8.2: 8 mil vs. 15 mil phosphorus bronze – measured magnetic field
Increasing the thickness of the shielding material from 8 to 15 mils provided an additional 7 dB of shielding effectiveness at the fundamental operating frequency as well as 5-7 dB more shielding effectiveness between the 2nd and 10th harmonic. The measured results are consistent with the predictions of the theoretical formulas and the simulated results. Similar results were obtained by Adamczyk, and are presented in [4].
Next, let’s look at the shielding effectiveness against the electric field.The reflection loss is specified by Eq. (6.2); the absorption loss is the same as for the magnetic field and is specified by Eq. (6.4). The simulated results for the electric field shielding for the reflection loss, the absorption and the total loss are shown in Fig. 8.3.
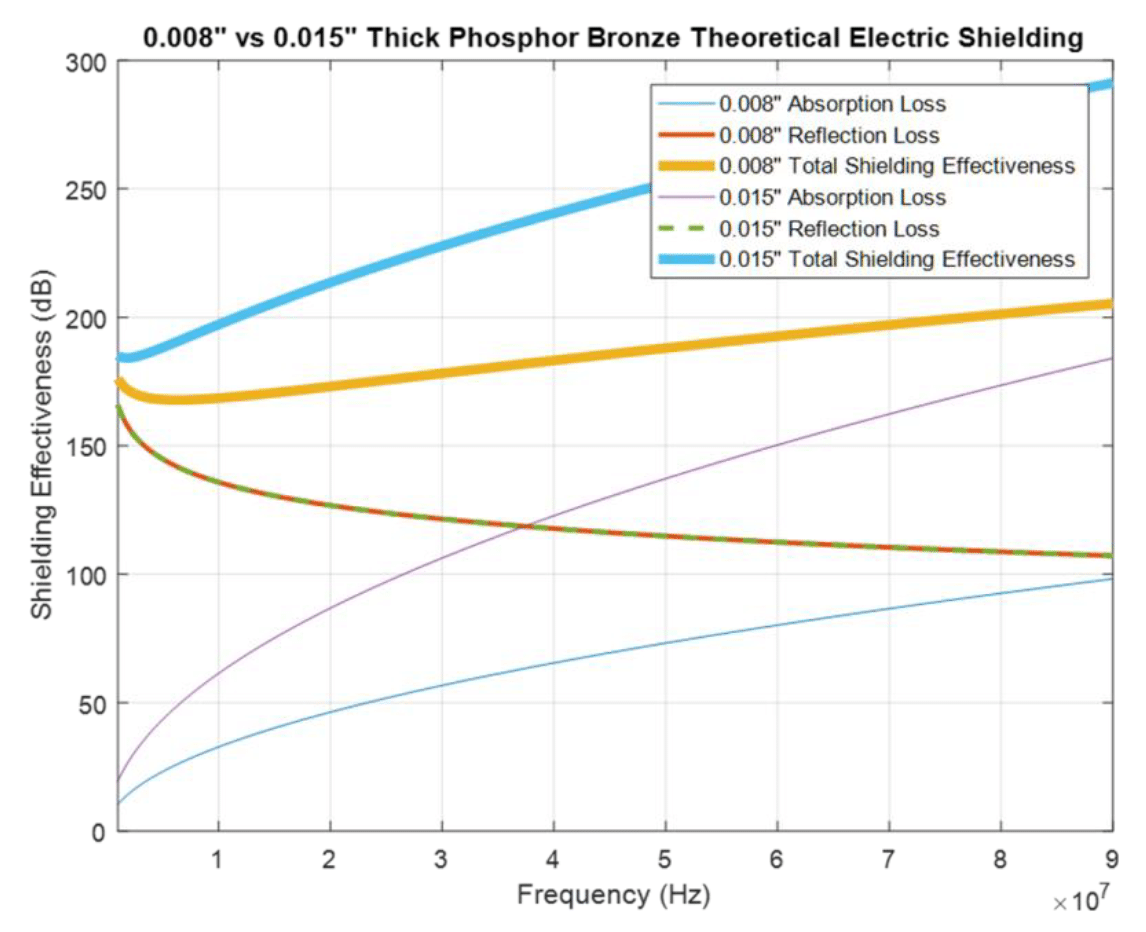 Figure 8.3: Phosphor bronze – 8 vs.15 mils: absorption, reflection, and total electric field loss
Again, the reflection loss is the same for both shields but the absorption loss is larger for the thicker shield. Thus, the total shielding effectiveness, against the electric field, of the 15-mil thick shield is larger than that of the 8-mil thick shield.
The electric field measurement results for the two shields are shown in Fig. 8.4.
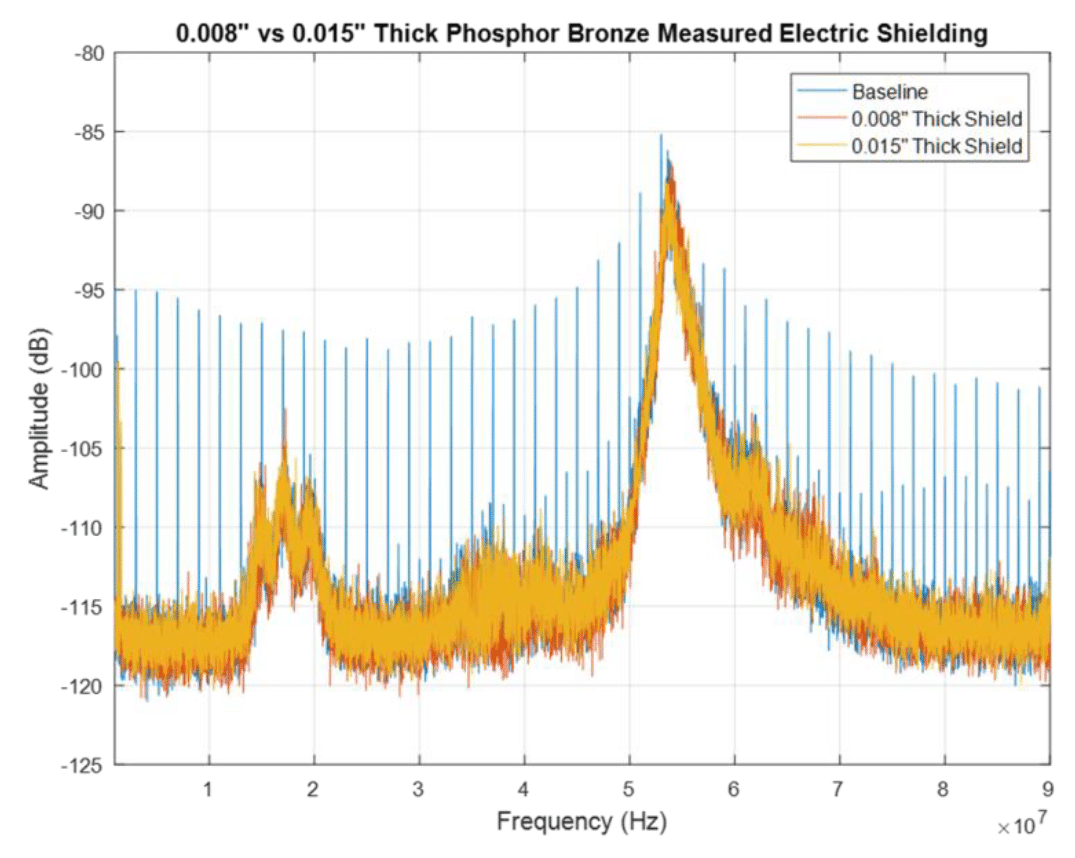 Figure 8.4: Phosphor bronze – 8 vs.15 mils: measured electric field
Since the raw measurements are hard to distinguish, let’s look at their envelopes, shown in Fig. 8.5
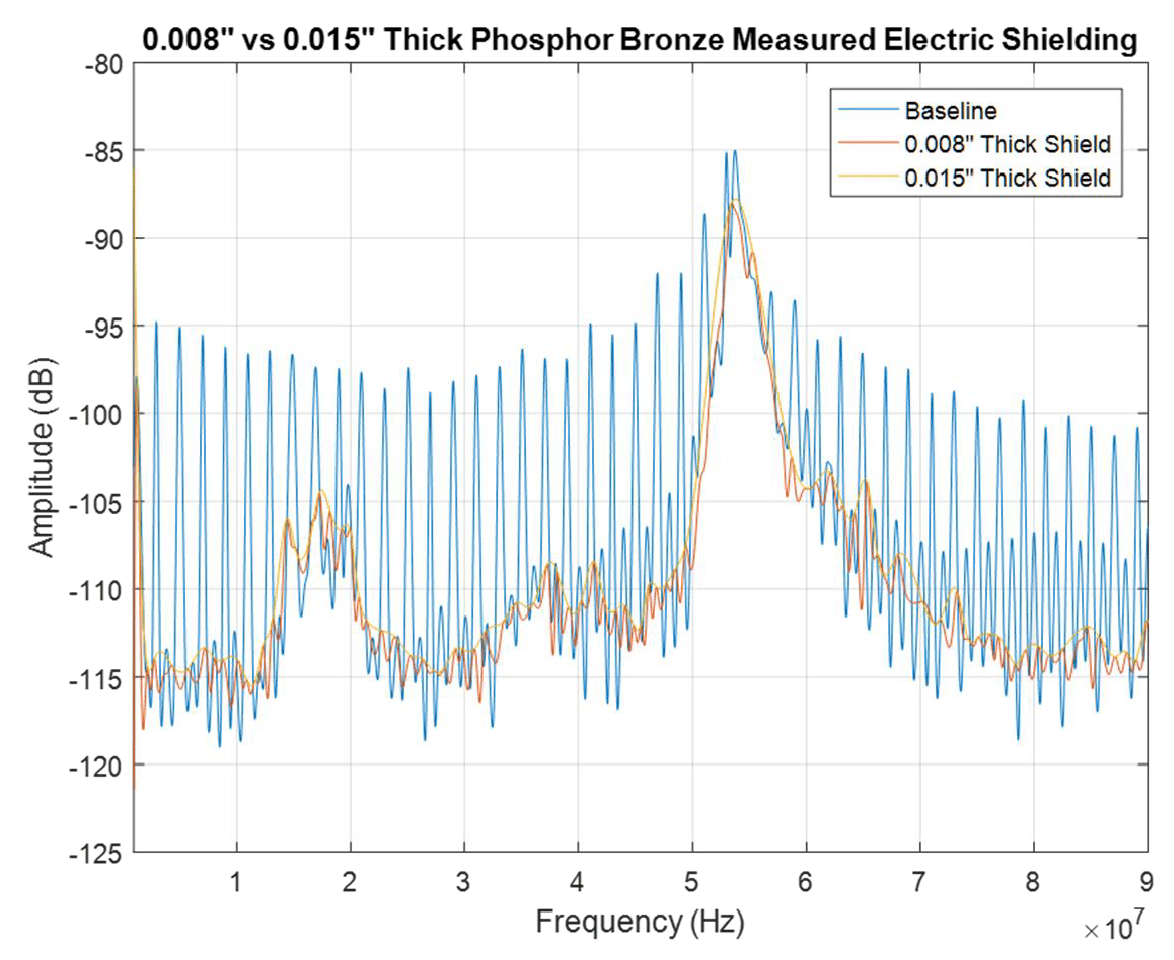 Figure 8.5: Phosphor bronze – 8 vs.15 mils: envelope of the measured electric field
It is apparent that both shields have a dramatic and similar effect on shielding against the electric field. While the theoretical formulas predict a significant difference in performance, especially at high frequencies, the measured results do not show this. (Note: the two broadband peaks, around 18 MHz and 53 MHz are due to the ambient noise present in the lab while performing the measurements).
The discrepancy can be explained by applying the theory discussed in Section 2 that was developed for the far –field, ideal scenario. Recall, when the shield is in the far field, or equivalently, impinged by a plane wave, the electric field is greatly reflected, regardless of the thickness and the material of the shield (as long as it is a good conductor).
Our shield is in the near field, so why the results of the far field might apply here? The answer is that the near field results were developed under the assumption of an infinitely small (point) source, and the physical source of the actual emissions is definitely not small. Thus, it is conceivable that some of the electric field lines are perpendicular to the shield, and thus the far –field theory (where the impinging field is normal to the shield) is applicable.
We will observe very similar results for the electric field measurements for all other shields discussed in this paper.
Phosphor Bronze – Nickel Silver – Carbon Steel – all 8 mil thick
The simulated results for the total magnetic loss for each shield are shown in Fig. 8.6.
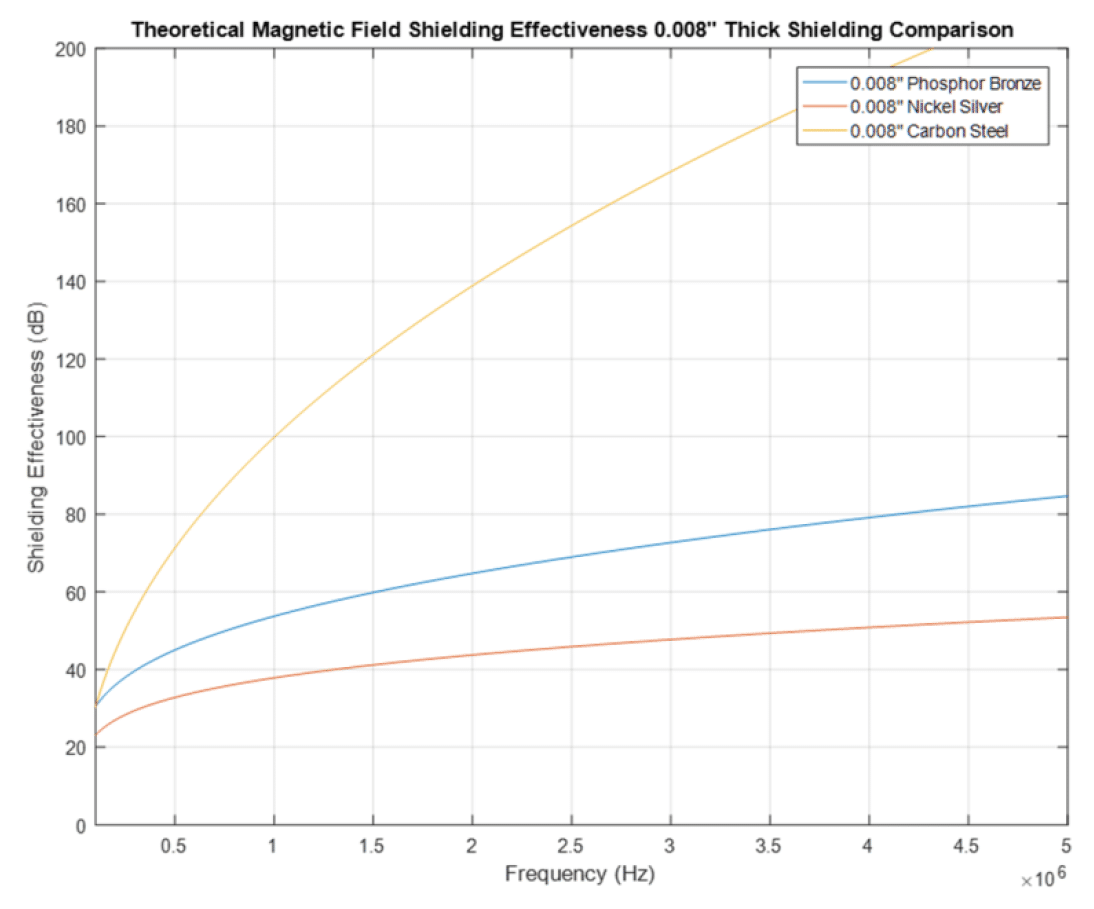 Figure 8.6: Different 8 mil shields – simulated total magnetic shielding effectiveness
The carbon steel shield clearly outperforms the other two shields, while phosphor bronze slightly outperforms nickel silver. The measured results are shown in Fig. 8.7.
Note that the measured results are consistent with the predicted simulated results. The carbon steel outperforms the other two shields, and phosphor bronze outperforms nickel silver. The carbon steel shield provides 25 dB of shielding effectiveness (vs. baseline) at the fundamental operating frequency as well as 32-36 dB from the 2nd to 10th harmonic was measured. This is due to the high absorption loss of the material which is made possible by having a relative permeability of 100.
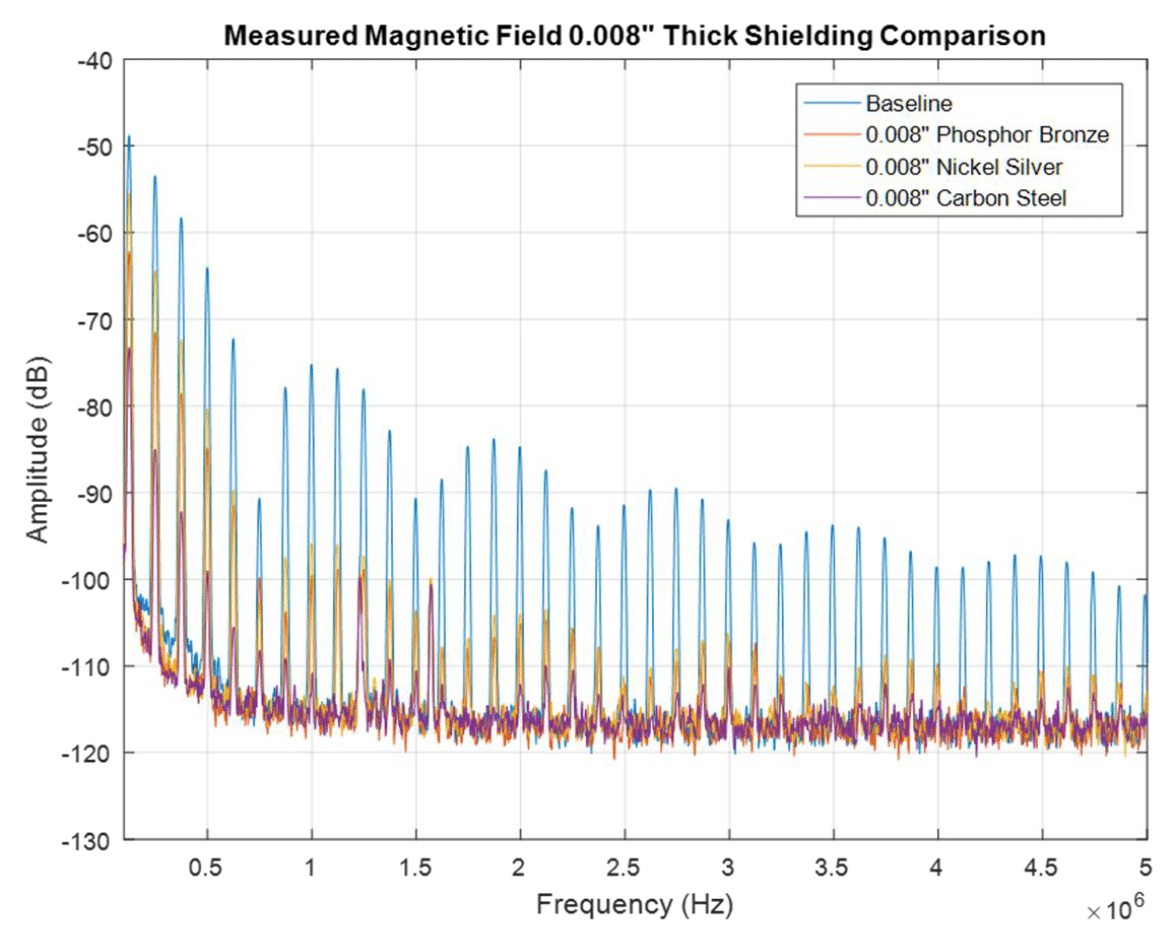 Figure 8.7: Different 8 mil shields – measured magnetic field
The relative permeability of phosphorus bronze is the same as that of nickel silver. The relative conductivity of phosphorus bronze, however is higher that of nickel silver. Thus, both the reflection loss and the absorption loss of phosphor bronzer is higher. The measurement results confirm these conclusions.
Nickel silver shield provided only a 5 dB shielding effectiveness at the fundamental and 14-22 dB between the 2nd and 10th harmonics.
Next, let’s look at the shielding effectiveness against the electric field. The simulation results for the total loss for each shield are shown in Fig. 8.8.
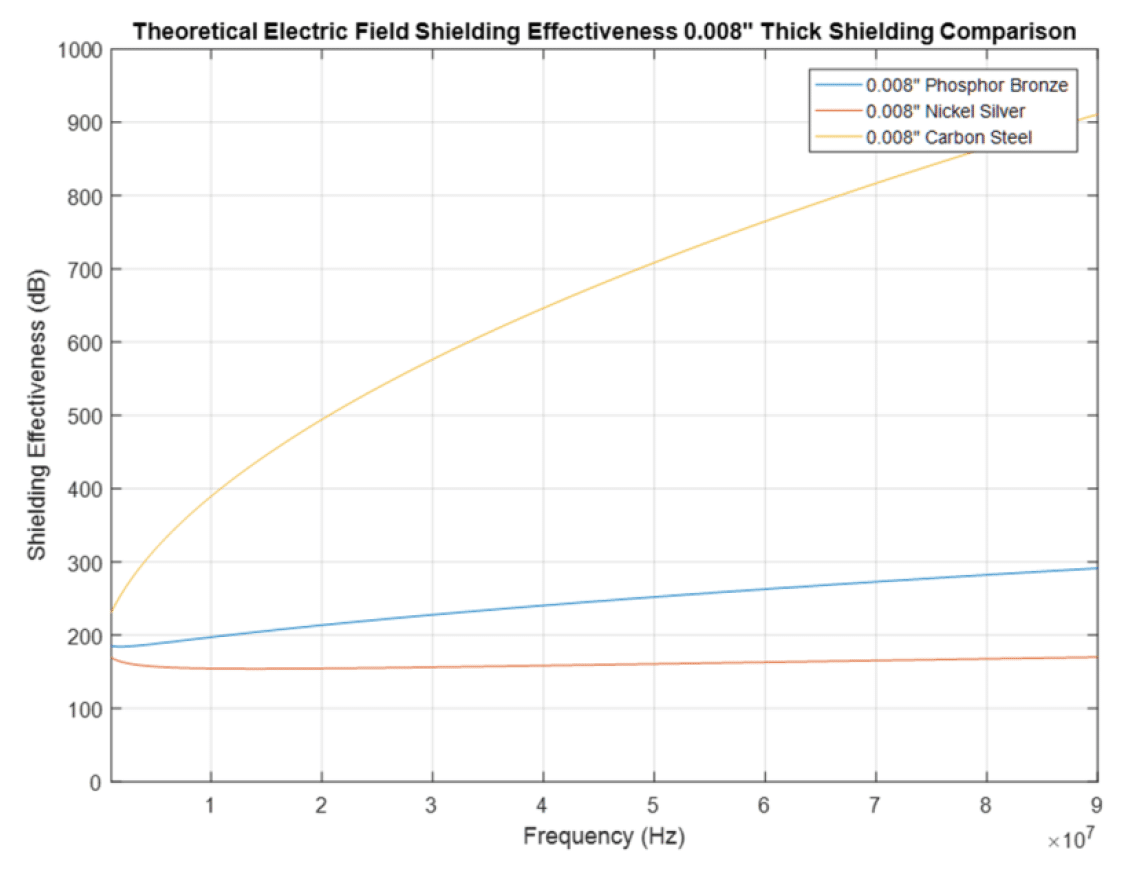 Figure 8.8: Different 8 mil shields – simulated total electric shielding effectiveness
The electric field measurement results for the three 8-mil shields are shown in Fig. 8.9.
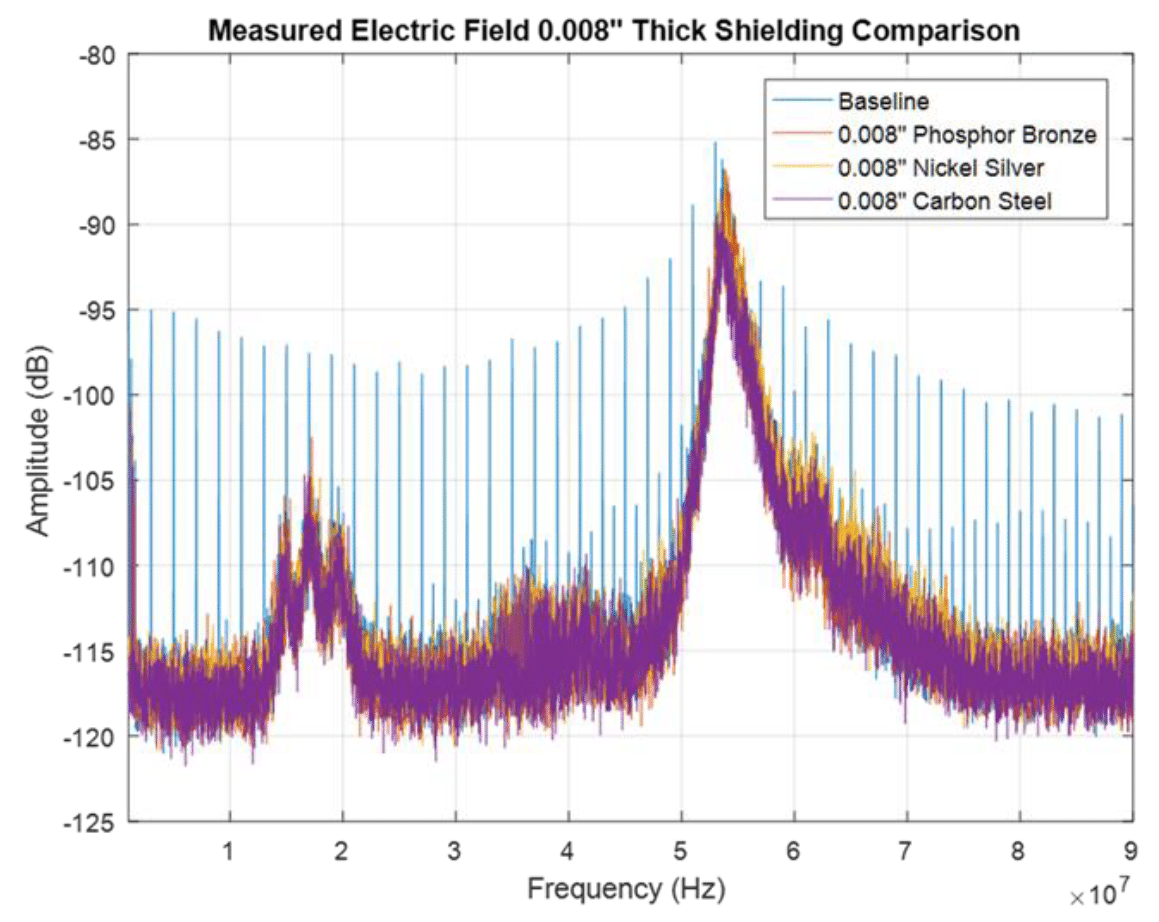 Figure 8.9: Different 8 mil shields – measured electric field
Again, an additional insight into the results is gained when looking at the envelopes of the measurements, shown in Fig. 8.10.
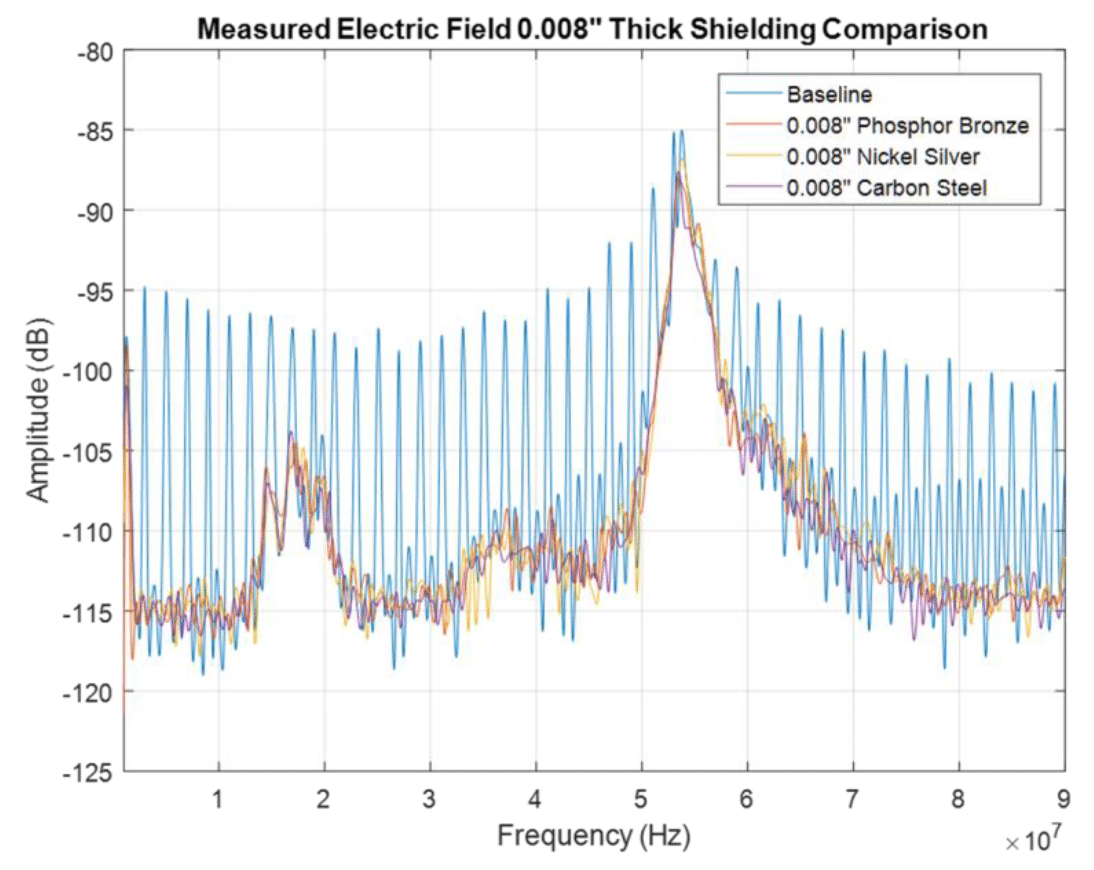 Figure 8.10: Different 8 mil shields – measured total electric shielding effectiveness
All shields have a dramatic and similar effect on shielding against the electric field. While the theoretical formulas predict significant differences in performance, especially at high frequencies, the measured results do not show this. This behavior can explained in the same manner as presented earlier for the 8 and 15 mil thick phosphor bronze shield.
Conclusions
This article presented the foundations of the shielding theory based on Schelkunoff‘s equations. The validity of these equations was assessed by performing the magnetic and electric field measurements in the near field of the source. It is shown that the H-field measurements in correlated with the results of Schelkunoff’s equations; the E-field measurements however, did not.
The measurement results of the electric field in the near field of the source adhered to the wave theory developed for the far field. A plausible explanation of this fact was postulated: the shielding theory was developed under the assumption of a point source, which is not the case for practical sources in the near field of measurements.
References
[1] S. A. Schelkunoff, Electromagnetic Waves, Van Nostrand, 1943.
[2] Henry W. Ott, Electromagnetic Compatibility Engineering, Wiley, 2009.
[3] Clayton R. Paul, Introduction to Electromagnetic Compatibility, Wiley, 2006.
[4] Bogdan Adamczyk, Foundations of Electromagnetic Compatibility with Practical Applications, Wiley, 2017.
