Vinod Kumar Dhar
Electronics Regional Test Laboratory (West)
Indian Ministry of Information Technology
Mumbai, India
Introduction
The converging factors, and sometimes real difficulties, that make electromagnetic compatibility (EMC) compliance a constant challenge have been repeated so often that they may seem commonplace. There is the growing complexity of modern electronic systems themselves coupled with demands for increased power and speed placed within smaller, streamlined designs. Blocking out the design of the electromechanical device within the chassis can affect immunity, and the integration of devices on the floor of the modern industrial plant escalates the probability of interference. Any two pieces of equipment connected to the same power bus can result in a detrimental interaction of EM fields. [1] Moreover, the connection of several devices to AC power mains adds yet another layer of potential problems. Power quality can cause problems within a machine, and the very cables that attach the machines to the mains can act as antennas giving off radiated emissions. Still, savvy design and test personnel recognize that familiar or not, these complexities must be dealt with.
Ideally, the issue of EMC compliance should be factored into the design process from its inception. Troubleshooting EMI requires the broadest possible perspective and the consideration of numerous possible sources of trouble. The unwanted radiofrequency energy appearing on conductors may arise from a galvancically connected source (e.g., AC power mains), or it may arise from capacitive or inductive coupling. All sources of conducted AC signals must be examined. Power cables, connectors, and safety grounds are all possible coupling paths.
Depending on the source, the coupling path, and the direction of flow, such powerline disturbances will appear in either common or differential mode. In common mode, EMI voltage appears between current-carrying conductors (line and neutral) and ground. The currents on line and neutral are in phase. In contrast, in differential mode EMI appears between the individual current-carrying conductors. The currents on these lines are out of phase [2]
Operation of EUT
In the instance of one microprocessor-controlled centrifuge (EUT or equipment under test) for a CFC (chloroflurorcarbon)-free cooling system, such forethought was not the case. This type of centrifuge is often found in research and development laboratories, pharmaceutical plants, and chemical facilities. It must be emphasized that this is a complex device including an AC drive; a brushless, three-phase inductor motor; microprocessor-controlled circuitry; a solenoid valve; and a refrigeration unit. Not surprisingly, given the lack of EMC planning, the circuitry of this electromechanical device produced a considerable level of electromagnetic interference (EMI).
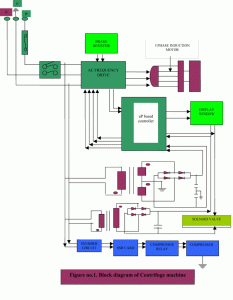
The effective operation of this machine is based on centrifugal force. Essentially, a test tube containing a sample is placed within a test tube cavity and is rotated at a predetermined speed. Particles fly outward, and depending on their densities are deposited in the upper or lower part of the test tube, thus achieving the desired separation of the sample content. Rotation takes place in a rotor head fitted to hold numerous test tubes. The refrigeration unit provides cooling for temperature-sensitive samples. The AC motor drive controls the speed of the three-phase induction motor, thus determining the speed of rotation. Prompts provided by the microprocessor allow the user to set desired speed, temperature, and duration of operation. (See the block diagram as shown in Figure 1.)
Analysis of Electrical Blocks
As a first step toward EMI compliance, all circuitry must be scrutinized. Figure 2 details the electrical blocks: the AC frequency drive, the three-phase induction motor, snubber circuit, solid state relay card, compressor relay, compressor, two step-down transformers, control card, display panel, and solenoid valve (safety lock). An input voltage of 230 VAC/50 Hz is supplied to an unshielded power mains cable (1.5 m long), which, in turn, is connected to the input AC frequency drive.
Tracing the diagram further, one finds the output of the frequency drive connected to the three-phase induction motor. The parallel voltage from the mains is fed to the two step-down transformers. Through the first transformer, output power flows to the bridge rectifier, which generates the DC signal and regulated output to the controller card, which ultimately allows user input and control of the centrifuge via the display panel keys. Even phase is looped to the AC frequency drive through the SCR (sequence control register) relay and the first step-down transformer.
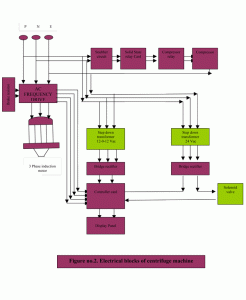
The output of the second step-down transformer is fed to the solenoid valve in series with the controller card signal, acting as a magnetic lock for safety purposes. Another parallel supply voltage flows to the snubber circuit, then to a solid-state relay card and through a compressor relay to the compressor itself. A break resistor with a nominal value of 100 to 200 W is connected to the drive motor.
Modeling of EMI Problems
Even a cursory examination of this electromechanical device indicated the probability of a considerable level of EMI. The integration of electrical blocks and the location of the compressor were indicative of potential problems. In fact, the physical layout as shown in Figure 2 was created with ill-planned, haphazard circuitry although the centrifuge did indeed separate samples. Actual examination of the centrifuge revealed problems far more extensive than could be indicated by any schematic. Extensive looping was found in all the interconnections, and even locating some of the power lines proved quite difficult.
Eventually, the problems were broken down into four models, each analyzing four categories—i.e., the AC frequency drive layout, control panel routing, filtering, and shielding and grounding integrity. Such careful analysis is essential to achieving EMC. Quantifying the exact emission levels produced by the device is the first step to locating the origins of the problem and to creating possible solutions. In many commercial applications, testers first assess the level of common-mode noise voltage. Usually, testers encounter conducted emissions in the 150-kHz to 30-MHz frequency range. (Cf. most international standards.)
Compliance Instrumentation Requirements
Obviously, the testing requirements of the various international standards for limiting and controlling EMI specify the use of receivers and transducers that respond to the particular type of noise in question. For example, CISPR 16-1-1 and CISPR 16-1-2 set forth the exact type of EMI receiver to be used for analysis and study of the energy distribution across the frequency spectrum of an electrical signal. An LISN (line impedance stabilization network) isolates the EUT from the ambient radio frequency on the power lines while providing a defined impedance across the power feed at the point where the terminal voltage is measured.
Test Setup for Conducted Emissions
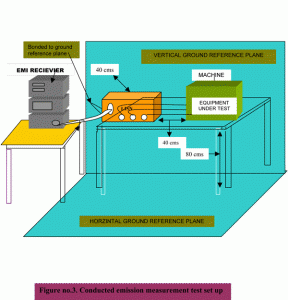
The conducted emission (CE) test configuration, per CISPR recommendations, is shown in Figure 3. This setup requires a ground reference plane (GRP) measuring 2mm x 2mm. The LISN is kept at a specified distance, and its ground terminal is bonded to the GRP by the shortest possible connection as indicated in Figure 3. This test setup is automated to facilitate fast measurements over a wide range of frequencies. The application software running on the EMI receiver automatically measures peak emission levels at preset frequencies, and resulting data appear on VDU (video display unit) terminals or the EMI receiver. Finally, results are “dumped” on a laser printer creating paper copies of observed conducted emission levels.
Modes of Detection
There are three modes of detection in EMI analysis—i.e., peak, average, and quasi-peak. In peak detection, the envelope of a signal is measured and displayed along with the measure value of the RMS (root mean square) signal to the CW (continuous) wave signal. If no modulation is found on the signal, then the peak voltage of the carrier has been detected. Use of the peak detector allows the tester to determine the “worst case scenario” vis-à-vis emission data.
For average voltage detection, basic circuitry involves an envelope detector (comparable to the peak detector) followed by an averaging network. This circuit is simply a low-pass or integrator/capacitor. An additional smoothing network includes a series of resistance and shunts capacitors—producing an end result of an averaging of random noise. This type of detection is often used for analyzing narrowband emission signals. In contrast, quasi-peak detection involves the analysis of broadband signals—a process achieved by incorporating various charge and discharge constants (depending on the frequency range) as a function of the pulse repetition rate. In essence, this final process estimates the “annoyance” factor. [3] [5]
EMI Analysis
In EMI analysis, signals are classified as either broadband or narrowband emissions. The term broadband denotes an emission with a signal bandwidth greater than that of reference bandwidth—i.e., the signal produced by the EMI receiver. Also, the pulse repetition frequency (PRF) is less than the reference bandwidth. Conversely, narrowband emissions are characterized by a bandwidth less than that of the reference signal and a greater PRF. [2][3]
Before turning to an analysis of the data obtained from the centrifuge, a review of the limits of BS EN 61326-1 (Ed. 1998) [6] is needed:
Initially, the EUT was evaluated at full operational speed per the manufacturer’s instructions. (See Figure 2.) The data obtained in phase and ground configuration are shown in Plots 1 and 2, respectively. The data reveal that observed peak emissions in phase and ground configuration in the range of 150 kHZ to 30 MHz have exceeded average and quasi-peak regulatory limits. Generally, emissions leveled off at about 102 to 60 dBmV.with the exception of a few peaks in the 16- to 18-MHZ range. Similarly, the peak emissions in neutral and ground configurations in the range of 150 kHz to 30 MHz also exceeded average and quasi-peak regulatory limits. These emissions leveled off at approximately 102 to 60 dBmV—again with a few peaks in the 16- to 18-MHz range.
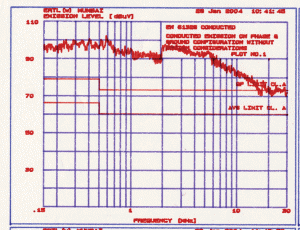
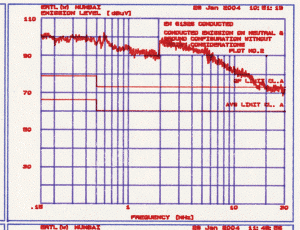
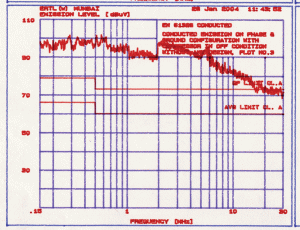
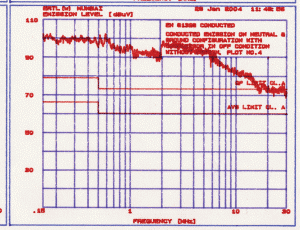
Next, emission levels were obtained with the compressor block of the EUT switched off. The resultant test data for phase and ground configuration and for neutral and ground configuration are shown in Plots 3 and 4, respectively. The test data reveal that the peak emission levels have not altered significantly in either configuration within the specified frequency ranges. Clearly, the machine in its original condition failed to comply with the applicable limits of the international standard. At this point, testers conjectured that failure arose from the overall inadequacy of the design, not just a lack of filtering, shielding, grounding, and other mitigation techniques. In particular, the design of the AC frequency drive appeared to be a key factor in non-compliance.

Design Remediation Measures
Reduction in emissions was achieved via the noise mitigation techniques illustrated in Figure 4. Also, unshielded cables connected to motors were replaced by the shielded variety. The shield end from the drive side was connected to the shield ground of the drive end, and another shield end from at the motor load side was connected to the motor chassis. The input and output power cables of the AC frequency drive were rerouted appropriately within the panel. Additional mains input filtering was attained by using suitable power line filters as shown in Figures 5 and 6, respectively. Holes on the refrigeration panel were redesigned taking into consideration the highest frequency found within the circuitry of the centrifuge. Grounding integrity was boosted with a rerouted design incorporating the shortest possible connections and the use adequate gauge wiring. Finally, filter circuits were incorporated within the machine housing, and the EUT’s power cord was shortened to less than one meter.
The AC frequency drive filter displayed the following nominal values:
Inductance (L) = 3.1 mH/line ±10%
X-capacitor = 0.68 mF ±20%
Y-capacitor = 10 nF ±20%
The electrical specifications of this filter included an operating voltage of 230 to 240 VAC/50 Hz; its maximum sustained load current was 15 A.
The compressor side filter displayed the following nominal values:
Inductance (L) = 60 mH/line ±10%
X-capacitor = 0.1 mF ±20%
Y-capacitor = 2.2 nF ±20%
The electrical specifications of this filter included an operating voltage of 230 to 240 VAC/50 Hz; its maximum sustained load current was 10 A.
Subsequently, the centrifuge was re-evaluated with all the remedial measures in place—including redesigned filter circuitry, shielding, screening, adequate grounding, and noise mitigation techniques incorporated into the EUT as shown in Figure 4. The centrifuge was operated at full speed at rated load conditions. The resultant emissions data are given in Plots 5 and 6, respectively. The observed data in phase and ground configuration and in neutral and ground configuration indicate that emission peaks are well below both the average and quasi-peak limits over the indicated frequency spectrum. The observed emission peaks level off at approximately 40 to 50 dBmV maximum at various points along the crucial frequency range.


Conclusion
Given the significant drop in emissions effected by the remediation measures and the EUT’s consequent compliance with international standards, it becomes obvious that careful design factoring in EMC compliance, adequate filtering, and attention to shielding and grounding are the key steps in insuring that electromechanical devices comply with regulatory limits and achieve the coveted CE mark.
Acknowledgments
I extend my sincere thanks to our Senior Director Shri P.H. Bhave for his timely cooperation and guidance provided during the preparation of this article. He has been a source of expertise and inspiration throughout the preparation of many technical articles. Also, my wife Mrs. Asha Fotedar deserves thanks for her help and encouragement.
References
1. White, Donald R.J. Filters and Power Conditioning Handbook. pp 8.1 to 8.67. July, 1985.
2. Violette, J.L. Norman, Electromagnetic Compatibility Handbook. November, 1987, pp 453 to 469.
3. “Operational Manual of Rohde & Schwarz ESI 26 EMI Receiver.” pp E-1 to E-14. March 2001.
4. “Operational Manual of Hewlett Packard 85685 A RF Preselector,” pp 1 to 15. July, 1985.
5. “Operational Manual of Hewlett Packard 8568 A Quasi-Peak Adapter.” pp 9 to 227, February, 1985.
6. BS EN 61236-1, “Electromagnetic Compatibility – Requirements for Industrial Environment.” pp 1 to 9, July 1998.
Vinod Kumar Dhar is an EMC scientist who has worked in the Ministry of Information Technology for the past 18 years at ERTL (W), Mumbai, India. His responsibilities include EMC laboratory setup, equipment installation, evaluation of products as per international standards, calibration of EMC equipment, and upgrade of test facilities. He also consults on EMC issues involving domestic, commercial, industrial, scientific, medical, and automotive electronic products. He has authored more than 25 pragmatic studies on EMC topics.


