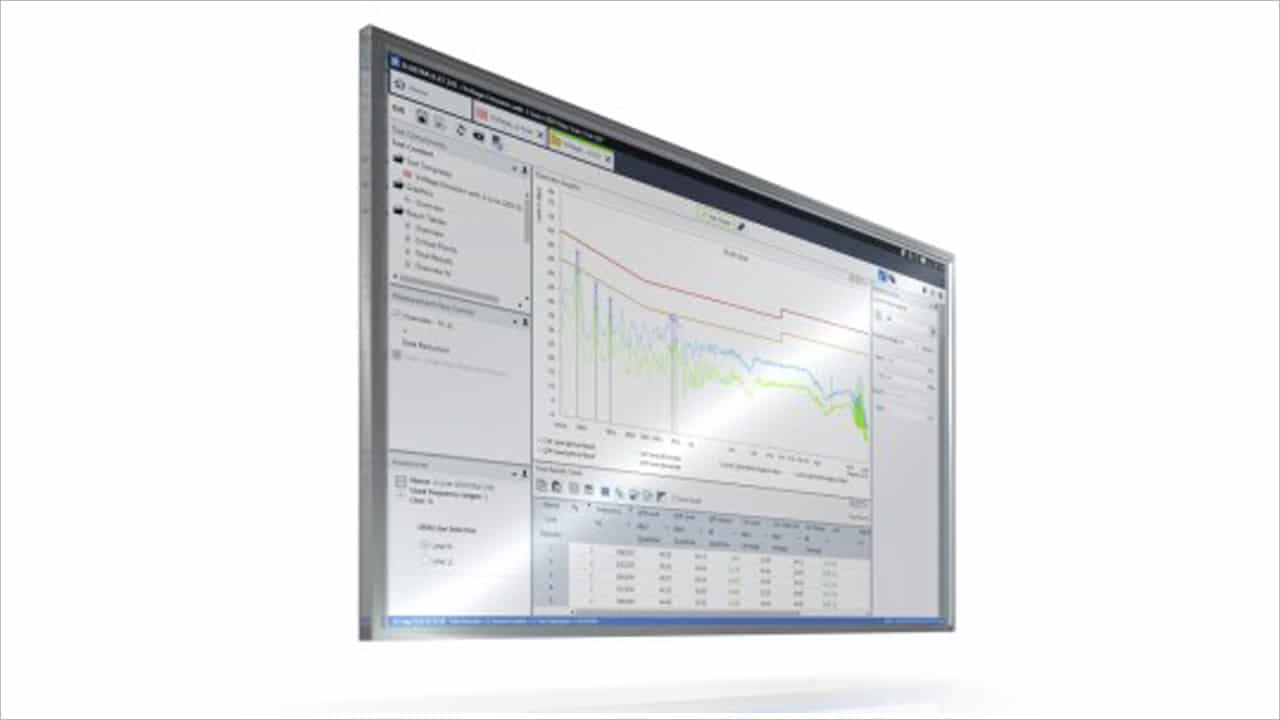
The R&S ELEKTRA EMI test software has been designed for easy and intuitive EMI measurements during product development. It supports EMI test receivers and spectrum analyzers from Rohde & Schwarz. Even development engineers or technicians who only occasionally use these instruments to measure electromagnetic interference are able to configure automated test sequences quickly, often right in the development lab, using GTEM cells or line impedance stabilization networks (LISN).
Manufacturers of electrical and electronic modules, components, devices and systems must perform electromagnetic compatibility (EMC) tests to ensure that their products will not interfere with other components or devices. Many manufacturers perform EMI precompliance tests during development to make sure that their products will pass the time-consuming and expensive final acceptance tests without any problems.
Rohde & Schwarz is now introducing the user-friendly R&S ELEKTRA EMI test software for measuring electromagnetic interference. The software is designed for use with EMI test receivers and spectrum analyzers from Rohde & Schwarz, and it supports both interactive and automated test sequences for many commercial products as well as for military applications.
Time-saving test sequences
The software performs a preview measurement based on predefined test templates to measure the DUTˈs frequency spectrum. The result is compared against appropriate limit lines. Time-consuming measurements with a standard-compliant detector will be performed only if limits are violated.
Conclusive EMI measurements in the lab
The R&S ELEKTRA EMI test software does not only provide the limit lines for the various test standards together with the antenna factors; it also delivers conclusive measurements in the development lab. For example, development engineers can use an LISN when measuring conducted disturbance. With smaller, battery-operated DUTs, a GTEM cell can be used; in this case, the R&S ELEKTRA EMI test software processes the measured values to generate results that are comparable to those that would be obtained during an open-site measurement with an antenna.
A dashboard on the user interface provides quick access to settings, tests, test templates, and other functions. Frequently used elements can be added to the dashboard as favorites. The software saves each test configuration with a block diagram, allowing users to quickly access individual parameters by clicking on the associated components.
The software provides reliable acquisition of measurement values. It documents results together with the test configuration and all instrument settings. Users can add descriptive text and images. Reports can be generated and exported in CSV, Excel and PDF format.


