Become a successful HERO tester in four easy steps.
Gaétan Duplain and Charles Leduc, Opsens, Inc., Quebec, Canada
Hazards from Electromagnetic Radiation to Ordnance (HERO), the potential for electromagnetic radiation to pose an adverse effect on munitions, is a familiar problem first identified in the 1950s. Avoiding the unintended detonation or malfunction of electrically initiated devices (EIDs) in an environment teeming with ever-increasing levels of electromagnetic energy is essential to every defense organization. With the constantly increasing power output and frequency range of transmitting equipment, the need to reduce this threat has become even more critical.
To assure the safety and intended function of ordnance and armament systems, test equipment has been developed to measure the effect of electromagnetic energy on electrically explosive devices (EEDs). Over the last few years, a new generation of instruments based on fiber optic technology has gradually replaced systems using thermocouples or infrared detectors. A very accurate and sensitive device, the fiber optic sensor (FOS) is extremely sensitive and assesses EEDs efficiently and rapidly. Given its dielectric nature, the FOS is totally immune to electromagnetic interference (EMI) that might be present in the sensing environment. Consequently, sensors based on fiber optic technology are quickly becoming the standard for HERO/RADHZ testing. Still, the essential requirements for reliable radiation assessment and the optimum implementation of this technology must be identified if FOS testing is to reach its full potential.
This article details the four “absolute musts” of a simple and integrated approach for using fiber optic technology that provides a reliable assessment of EMI/HIRF effects on ordnance—viz. 1) an accurate and flexible sensor, 2) reliable EED assembly, 3) precise EED current response, and 4) all-in-one instrumentation.
ACCURATE AND FLEXIBLE SENSORS
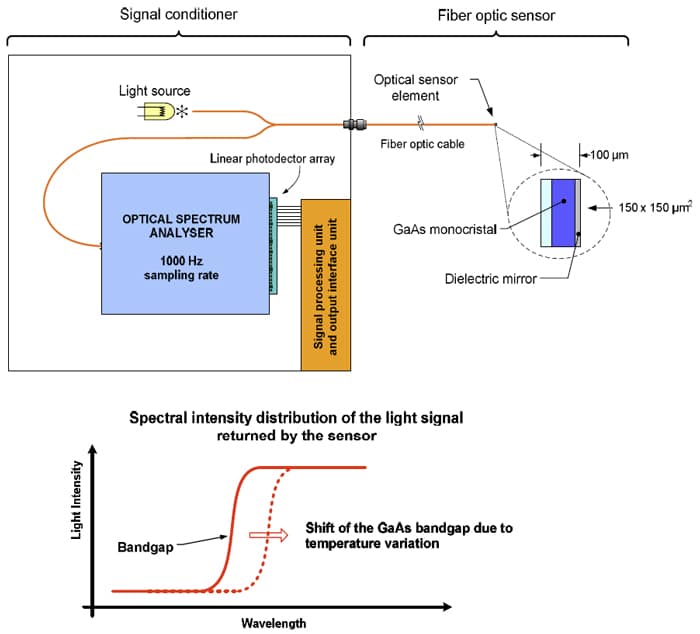
The HERO/RADHAZ testing method detailed below is based on a very sensitive and accurate fiber optic sensing technology known as SCGB (semiconductor band gap). The SCGB-based fiber optic sensor is designed to measure the EM-induced temperature rise in EED band wires or similar devices. SCGB is a mature technology based on a simple, yet robust spectrophotometic technique. The essential principle underlying this technology is the dependence of the optical transmission properties of gallium arsenide (GaAs) monocrystal. Simply stated, GaAs monocrystal is a material that is opaque to all wavelengths of light below a specific wavelength transmission region (the band gap). Conversely, it is transparent to all wavelengths of light above the band gap. The wavelength transmission region (the band gap spectral position) is a function of temperature. SCGB technology determines changes in the band gap spectral position by monitoring temperature.
The schematic of the SCGB technology is shown is Figure 1. The fiber optic temperature sensor is composed of a miniature GaAs crystal bonded to the tip of an optical fiber. Light injected from the signal conditioner into the optical fiber is directed up to the GaAs crystal. The latter absorbs wavelengths of light below the band gap spectral position and reflects back to the signal conditioner those wavelengths above the spectral band gap. Light reflected back to the signal conditioner goes into a miniature optical spectrum analyzer (OSA) that spatially decomposes the light into its wavelength constituents. A linear CCD (charge-coupled device) array of optical detectors measures the intensity of light at these wavelengths. Each pixel of the CCD array corresponds to a specific calibrated wavelength; therefore, the whole detector array indicates the spectral intensity distribution of the light reflected back by the GaAs crystal. A typical spectral intensity distribution curve is shown in Figure 1.
The Technology
The band gap spectral position is calculated from the light spectral intensity distribution and is then converted into an absolute temperature reading. Unlike interferometric techniques used in similar applications, the SCGB spectrophotometric technique is not sensitive to mechanical vibration and fiber-optic movement, a characteristic critical to HERO and RADHAZ applications.
SCGB technology offers both absolute and relative temperature measurements without the necessity of providing the measurement system with calibration factors prior to using the sensor. Sensors can be mixed and matched with all the measurement channels of the system without calibrating the sensor to a specific channel. This option presents numerous advantages:
- Elimination of manual entry to the
system, thus reducing the risk of
human errors; - Avoidance of inaccurate results
caused by calibration factor mismatch
with the sensor used in the
testing process; - Sensor-to-sensor consistency;
- Significant improvement in setup
time and productivity with a simple
connect and measure feature
The user should be able to switch easily from absolute to relative temperature measurements, i.e., the difference between the actual temperature and a reference temperature point.
The Requirements
Given the critical challenges posed by HERO/RADHAZ testing and EED assessment, any sensor used must be totally immune to EMI. To achieve reliable and precise results, the sensor must demonstrate no measurable susceptibility to optical fiber movements, nor should it be sensitive to mechanical vibrations. Also, the sensor must be impervious to optical fiber bending and optic-fiber connections/disconnections as these factors can affect the capacity to support more than one connection without any degradation of sensitivity and accuracy.

Such external disturbances can generate significant output reading errors and unusable measurement results, a situation that can occur when using fiber-optic interferometric technology. Fortunately, SCGB technology is completely immune to such problems. For example, multiple connections can be set without impacting measurement accuracy. Also, sensors can be used in high vibration environments such as those found in fighter aircraft.


Finally, the sensor must be easy to assemble for use with all types of bridge wire-based EEDs. SCGB technology provides a miniature sensor (150 x 150 x 100 μm3 or less) to fit in very small spaces such the compact design of some EEDs. Posing a minimal encumbrance, the entire sensor assembly, including the cable sheath, should be easily adaptable to the test environment.
A RELIABLE EED ASSEMBLY: THE ESSENTIAL STEPS
The Setup
The success of HERO/RADHAZ testing depends largely on the quality of the assembly. Fiber optic sensors are useless if not mounted properly on the bridge-wire EED. Appropriate tools and precise assembly methods are needed to install a sensor no larger than a human hair on a fragile bridge wire that is often hidden at the bottom of a very small EED. Creating a robust assembly necessitates the use of an installation bench with simple micromanipulators, magnifying lenses, and holders. An appropriately equipped assembly bench avoids time-wasting manipulations and significantly reduces the possibility of a faulty mounting. Most importantly, using a well-designed EED holder assembly (called the EED adapter) to hold the EED and sensor together is crucial. A properly equipped installation bench facilitates the crucial step of placing the sensor (i.e., the GaAs crystal) in thermal contact with the bridge wire of the EED. The sensor should be fixed so as to maintain a slight positive pressure on the bridge wire as detailed in the assembly details explained below.
The Assembly
The step of placing the sensor (or crystal) in thermal (conductive) contact with the bridge wire is crucial to attaining maximum sensitivity. It should be noted that the GaAs crystal can be placed in direct contact with the bridge wire without altering its inherent electrical and electromagnetic properties. Still, it is important to apply a moderate tension on the bridge wire. Over-tensioning the bridge wire can damage the crystal (e.g., the crystal could detach from the fiber tip), and it can create heat-sink effects if the bridge wire comes in contact with the EED housing.
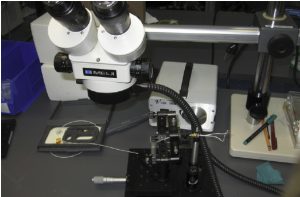
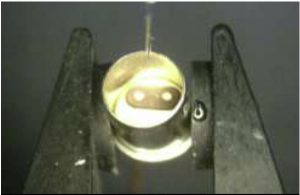
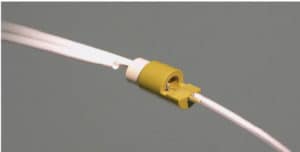
Figure 2 illustrates a typical EED assembly bench with the minimum required equipment for achieving the control that will facilitate effective mounting of the crystal on the bridge wire. Included are a binocular, holders, and micro-manipulators. Figure 3 illustrates the step of fixing the EED, with exposed bridge wire, on the installation bench. Using adapted holding parts, the EED is positioned so as to avoid any movement during the installation process. In Figure 4, the temperature sensor is installed near the EED. The sensor is held firmly to avoid unwanted lateral movement, and Figure 5 shows the sensor being positioned in contact with the bridge wire using micro-manipulators. Finally, in Figure 6 the installation is completed by fixing the optical fiber to the EED adapter.
Adaptability
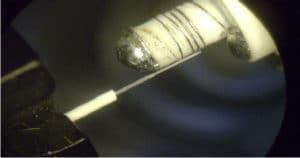
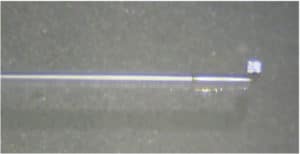
EEDs come in a variety of shapes and models—from the standard MK1 to sophisticated and custom-made devices. In each instance, the sensor must adapt to the EED device without alteration of its electrical characteristics and/or its EMI immunity. The temperature sensor should mount easily on standard and common EEDs such as the MK1 and the RR-2. Figure 7 shows a well-designed adapter used for secure connection of the optical fiber with the EED device, thus assuring a robust, reliable assembly. In some instances, care must be taken to adapt the sensor geometry to varying bridge wire designs with minimal disruption to the overall testing process. For example, Figure 8a shows a bridge wire coiled around a cylinder so that the optical fiber must be placed parallel to the cylinder. A specially designed sensor with its crystal mounted on the side of the optical fiber (Figure 8b) is used in this instance.
PRECISE EED INDUCED CURRENT RESPONSE MEASUREMENTS
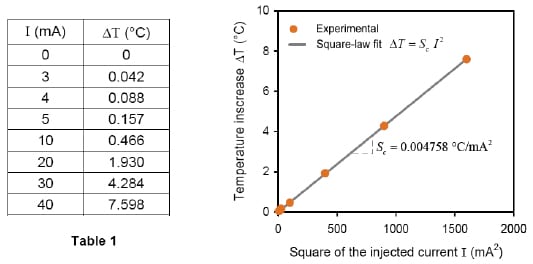
Accurate calibration made easy Calibration of the instrumented EED (i.e., the EED/sensor assembly) prior to use measures the induced current response when subjected to electromagnetic radiation. The calibration curve obtained indicates the relationship between the injected current in the EED bridge wire and the increase in the bridge wire temperature as measured by the temperature sensor. The table in Figure 9 is a numeric depiction of the calibration data while the graph to its right shows the calibration curve of an instrumented MK1 EED. This figure clearly demonstrates that the calibration curves track with remarkable accuracy the theoretical square laws response of EED devices, in which the increase in the bridge wire temperature is proportional to the square of the current flowing through it. The proportional constant, labeled I-square Sc, is easily calculated from this curve and is equal to 0.004758 º C/mA2 in this particular case.

EED Induced Current Response in Various Units (mA, dB, μW)
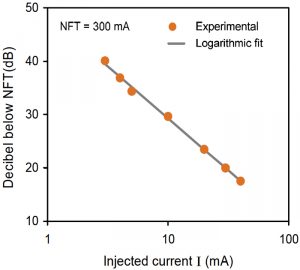
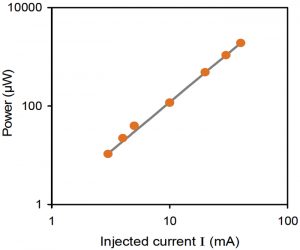
Once Sc is determined for a particular EED, it is easy to set up the control and readout instrument (RadSens signal conditioner) to output in various units such as in milliamperes, in decibels below NFT (no fire threshold) and in microwatts, as well as in the standard temperature units (absolute or relative temperature). The following EED current response examples were taken with an OTG-R fiber-optic temperature sensor (designed for EED testing) assembled to a Mark-1 (MK1) EED. The MK1 EED has an NFT of 300 mA and an ohmic resistance of 1.2 Ω. The MK1/ OTG-R assembly was connected to a PSR-100 measuring module of the RadSens signal conditioner. The calibration curve provided the I-square sensitivity Sc, which is equal to 0.004758 ºC/mA2 in this case. The data were collected in real time at a sampling rate of 1 kHz through the Ethernet/LAN port of the RadSens instrument.
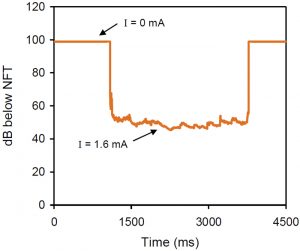
Figure 10 shows the current response in milliamperes that was measured by setting the RadSens instrument to output in mA. As anticipated, the response is very linear. Figure 11 shows the current response curve in decibels below NFT. As expected, the response follows a logarithmic curve. Figure 12 shows the result when the RadSens was set to output in microwatts. The result is a response curve that, as expected, follows a power law curve (shown on a log-log scale).
Ultimate Current Sensitivity and Response Time
Figure 13 shows the smallest curve detected on an instrumented MK1. The output of the RadSens instrument was set in dB below NFT. A minimum of 1.6 mA current was clearly detected. This current corresponds to 45 dB below the NFT point of the MK1 EED. The OTGR sensor used for the instrument EEDs has a response time of 10 ms or less. The EED/OTG-R assembly has a typical response time of 375 ms or less. (Note that for practical reasons, all readings above 99 dB are arbitrarily given that limit value.)
Adaptive Noise Removal Filters
There is always some noise associated with a signal obtained from the measurement of observable physical properties such as temperature. This noise can be reduced significantly by electronic or analog digital filtering. At present, digital filters produce results unattainable with analog filters; hence, they are the preferred choice in signal processing operations. Signal conditioners with 100 percent digital electronics and digital signal processing capabilities can perform digital filtering of almost any type.

A running average filter is the most common type used to remove digital noise components of a measured signal. The output of this type of digital filter is the average of the N most recent measurement values. Clearly, the noise removal performance of this filter depends on the value of N; a higher value results in better noise cancellation. Although a running average filter is a very good choice for noise removal, it comes with two major drawbacks. First, the filter is not causal; therefore, it always introduces a delay (equal to N/2 sampling period) into the signal. Consequently, increased noise removal performance is accompanied with a longer delay. Secondly, the filter attenuates the high frequency components of the signal. In other words, the filter is unable to track rapid signal variations. Fortunately, an adaptive filtering alternative eliminates these drawbacks.
A high performance, digital noise removal adaptive filter can significantly improve the resolution of a signal conditioner with compromising response time. The term adaptive signifies that the filter is able to alter its performance in real time in response to various signal conditions and to select the optimal filtering parameters. In this instance, the adaptive filter is a true causal filter that does not introduce additional delay to the signal. While it is able to reduce noise by several orders of magnitude, it also responds to fast signal variations with minimal attenuation of the high frequency components of the signal. In terms of digital filtering, an adaptive filter can be conceptualized as a discrete, first-order, low-pass filter with a self-adjusting filter-time constant.
Figure 14 clearly demonstrates the outstanding performance of an adaptive filter as compared to a running average filter. The light blue line represents the unfiltered running measurement data while the red and dark blue lines represent the performances of the running average and adaptive filters, respectively. Eyeing the left of the figure, where little variance in temperature is indicated, one notes that both types of filter produce very good and similar noise removal. Tellingly, the performance of these two filters is quite different when the signal changes rapidly. Note the first signal spike on the left indicating that the running filter is unable to track rapid signal variations.
Since the running average filter severely attenuates the high frequency components of the entire signal input, it does not output the original filter signal correctly. Also, note the delay in the output signal of this filter that can be seen on the third signal spike from the left, where the output signal peak of the running average filter occurs hundreds of milliseconds later than the peak in the raw signal. Conversely, the adaptive filter accurately tracks the rapid variation of the signal. The measurements show that there no significant delay or attenuation between the raw signal input and the signal output of the adaptive filter.
Embedded Current Source and Calibration Software
Instrumented EEDs must be calibrated before any measurements are taken. Calibration can be a long and demanding task when dealing with a large quantity of EED devices. The combination of an embedded current source and automated calibration software provides the test technician with a very efficient EED calibration tool. With this testing technique, each instrumented EED can be calibrated in a consistent manner with a minimum of effort and minimal risk of error. Once the user has determined the required current calibration points, specifically designed software will carry out the calibration and will automatically calculate the I-square sensitivity Sc as described above. The calibration results should be displayed in numeric and graphical forms and can be saved in MS Excel™ or a similar format.

ALL-IN-ONE INSTRUMENTATION

At present, there is a significant trend toward all-in-one instrumentation— especially in the case of sophisticated monitoring and measuring applications. Certainly, everyone involved in the field of HERO/RADHAZ testing welcomes this trend. Using a different instrument for each step in the measurement chain (signal conditioning, data acquisition, data treatment, management, and analysis) only increases the risks of errors and inconsistent results. An all-in-one instrument should offer the following features:
- Digital signal processing and conditioning
at a sample rate up to
1000 Hz - On-board computer for real-time
data acquisition and transfer - A user-friendly interface with meaningful
results displayed in numeric
and graphical forms - An integrated calibration tool and
software - Embedded data filtering and analysis
- Integrated data storage for local data
management - Ethernet interface for PC real-time
data download and remote control.
A user-friendly graphical interface that can display real-time measurements in various numeric and graphical forms along with measurements statistics facilitates the validation of on-going tests and triggers prompt intervention by the tester in case of problems or unexpected results.
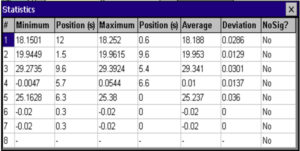
Measurements can be displayed in a line graph format similar to electrocardiogram waveform (ECG display) in which each EED monitored is shown with a different color for efficient data comparison as shown in Figure 15. Figure 16 shows measurement results displayed as bar graphs, a format that readily identifies peak level and problematic assemblies. An alarm level indicator can be adjusted by the tester. Figure 17 shows measurement statistics (minimum, maximum, average, and standard deviation) calculated and displayed in real time. The no-signal condition is tracked as well.
CONCLUSION
Being a successful HERO tester does require following certain rules. Even the latest fiber optic sensing technology solution is of little help if does not meet the basic requirements for attaining accurate and reliable results. A basic requirement is accurate and flexible sensors that are easy to install on any kind of EED. The test system should offer precise calibration features and must provide results in various engineering units. It should include smart data processing with real-time readings and efficient noise filtering for optimal results. With built-in data management functions, a “ready-to-use” test solution should also offer friendly interfaces without the need for any additional analog-to-digital converters, software programming, or computer systems.
Mastering each of these steps is essential to efficient, reliable HERO/RADHAZ testing. Compliance validation goes beyond the simple concept of measurement. It must also confirm, without a doubt, that unintended detonation or malfunction of electro-explosive devices will not occur.
REFERENCES
1. Duplain, G. Fiber Optic Sensor for Assessment of Bridge-Wire Electro- Explosive Devices (EEDs). Opsens presentation, UK Division, 2006.
2. Johnson, D. Mark. DoD Logistics IPT/AIT, Hazards of Electromagnetic Radiation to Ordnance Concerns for Wireless Technologies. Presentation NSWC, Dahlgren, VA, 2005.
ABOUT THE AUTHORS
Gaétan Duplain have been Vice President, R&D Energy Sector and Director of Opsens since its creation in May 2003. His main tasks include leading research activities in the energy sector by orienting the main lines of commercial and intellectual property development and overseeing execution of the action plan of the company. In May 1994, he co-founded a company that specializes in the manufacturing of fiber optic sensors, for which he held the position of Vice President from 1994 until 2003. In said company, he acquired experience in strategic planning and the development of high technology businesses. He holds a Bachelor’s degree in Physical Engineering from Université Laval that was obtained in 1983. He also holds a Master’s degree in Optic and Laser obtained in 1986 from the same university.
Charles Leduc is an engineer who has worked in the fiber optic market for the last 12 years. His experience as a Product Line Manager for telecom companies was mainly focused on solution implementation and product development. Now Sales Director for the industrial and scientific production line at Opsens, he is responsible for market development related to military, aerospace and laboratory applications.


